

will government's massive surge in investment ... - Myiris.com
will government's massive surge in investment ... - Myiris.com
will government's massive surge in investment ... - Myiris.com

You also want an ePaper? Increase the reach of your titles
YUMPU automatically turns print PDFs into web optimized ePapers that Google loves.
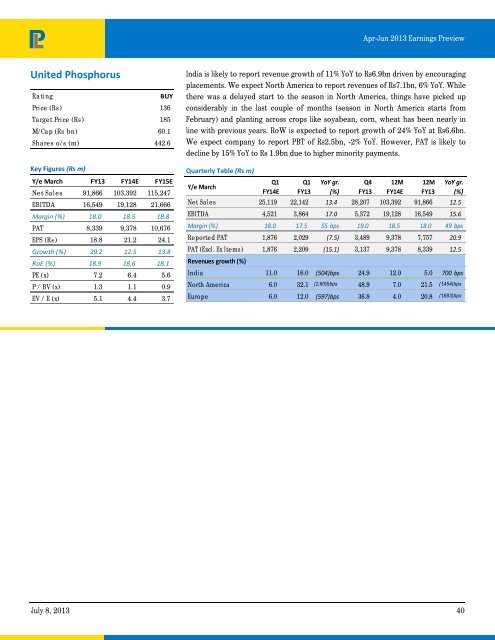
Apr-Jun 2013 Earn<strong>in</strong>gs Preview<br />
United Phosphorus<br />
Rat<strong>in</strong>g<br />
BUY<br />
Price (Rs ) 136<br />
Target Price (Rs) 185<br />
M/Cap (Rs bn) 60.1<br />
Shares o/s (m) 442.6<br />
Key Figures (Rs m)<br />
Y/e March FY13 FY14E FY15E<br />
Net Sales 91,866 103,392 115,247<br />
EBITDA 16,549 19,128 21,666<br />
Marg<strong>in</strong> (%) 18.0 18.5 18.8<br />
PAT 8,339 9,378 10,676<br />
EPS (Rs) 18.8 21.2 24.1<br />
Growth (%) 29.2 12.5 13.8<br />
RoE (%) 18.9 18.6 18.1<br />
PE (x) 7.2 6.4 5.6<br />
P / BV (x) 1.3 1.1 0.9<br />
EV / E (x) 5.1 4.4 3.7<br />
India is likely to report revenue growth of 11% YoY to Rs6.9bn driven by encourag<strong>in</strong>g<br />
placements. We expect North America to report revenues of Rs7.1bn, 6% YoY. While<br />
there was a delayed start to the season <strong>in</strong> North America, th<strong>in</strong>gs have picked up<br />
considerably <strong>in</strong> the last couple of months (season <strong>in</strong> North America starts from<br />
February) and plant<strong>in</strong>g across crops like soyabean, corn, wheat has been nearly <strong>in</strong><br />
l<strong>in</strong>e with previous years. RoW is expected to report growth of 24% YoY at Rs6.6bn.<br />
We expect <strong>com</strong>pany to report PBT of Rs2.5bn, -2% YoY. However, PAT is likely to<br />
decl<strong>in</strong>e by 15% YoY to Rs 1.9bn due to higher m<strong>in</strong>ority payments.<br />
Quarterly Table (Rs m)<br />
Y/e March<br />
Q1<br />
FY14E<br />
Q1<br />
FY13<br />
YoY gr.<br />
(%)<br />
Q4<br />
FY13<br />
12M<br />
FY14E<br />
12M<br />
FY13<br />
YoY gr.<br />
(%)<br />
Net Sales 25,119 22,142 13.4 28,207 103,392 91,866 12.5<br />
EBITDA 4,521 3,864 17.0 5,372 19,128 16,549 15.6<br />
Marg<strong>in</strong> (%) 18.0 17.5 55 bps 19.0 18.5 18.0 49 bps<br />
Reported PAT 1,876 2,029 (7.5) 3,489 9,378 7,757 20.9<br />
PAT (Excl. Ex Items) 1,876 2,209 (15.1) 3,137 9,378 8,339 12.5<br />
Revenues growth (%)<br />
India 11.0 16.0 (504)bps 24.9 12.0 5.0 700 bps<br />
North America 6.0 32.1 (2,609)bps 48.9 7.0 21.5 (1,454)bps<br />
Europe 6.0 12.0 (597)bps 36.8 4.0 20.8 (1,683)bps<br />
July 8, 2013 40


