

will government's massive surge in investment ... - Myiris.com
will government's massive surge in investment ... - Myiris.com
will government's massive surge in investment ... - Myiris.com

You also want an ePaper? Increase the reach of your titles
YUMPU automatically turns print PDFs into web optimized ePapers that Google loves.
Apr-Jun 2013 Earn<strong>in</strong>gs Preview<br />
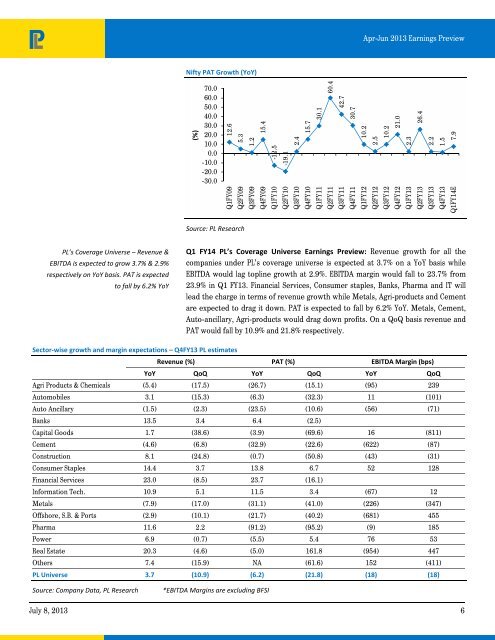
Nifty PAT Growth (YoY)<br />
(%)<br />
70.0<br />
60.0<br />
50.0<br />
40.0<br />
30.0<br />
20.0<br />
10.0<br />
0.0<br />
-10.0<br />
-20.0<br />
-30.0<br />
Q1FY09<br />
Q2FY09<br />
Q3FY09<br />
Q4FY09<br />
Q1FY10<br />
Q2FY10<br />
Q3FY10<br />
Q4FY10<br />
Q1FY11<br />
Q2FY11<br />
Q3FY11<br />
Q4FY11<br />
Q1FY12<br />
Q2FY12<br />
Q3FY12<br />
Q4FY12<br />
Q1FY13<br />
Q2FY13<br />
Q3FY13<br />
Q4FY13<br />
Q1FY14E<br />
12.6<br />
5.3<br />
1.2<br />
15.4<br />
-12.5<br />
-19.1<br />
2.4<br />
15.7<br />
30.1<br />
60.4<br />
42.7<br />
30.7<br />
10.2<br />
2.5<br />
10.2<br />
21.0<br />
2.3<br />
26.4<br />
2.2<br />
1.5<br />
7.9<br />
Source: PL Research<br />
PL’s Coverage Universe – Revenue &<br />
EBITDA is expected to grow 3.7% & 2.9%<br />
respectively on YoY basis. PAT is expected<br />
to fall by 6.2% YoY<br />
Q1 FY14 PL’s Coverage Universe Earn<strong>in</strong>gs Preview: Revenue growth for all the<br />
<strong>com</strong>panies under PL’s coverage universe is expected at 3.7% on a YoY basis while<br />
EBITDA would lag topl<strong>in</strong>e growth at 2.9%. EBITDA marg<strong>in</strong> would fall to 23.7% from<br />
23.9% <strong>in</strong> Q1 FY13. F<strong>in</strong>ancial Services, Consumer staples, Banks, Pharma and IT <strong>will</strong><br />
lead the charge <strong>in</strong> terms of revenue growth while Metals, Agri-products and Cement<br />
are expected to drag it down. PAT is expected to fall by 6.2% YoY. Metals, Cement,<br />
Auto-ancillary, Agri-products would drag down profits. On a QoQ basis revenue and<br />
PAT would fall by 10.9% and 21.8% respectively.<br />
Sector‐wise growth and marg<strong>in</strong> expectations – Q4FY13 PL estimates<br />
Revenue (%) PAT (%) EBITDA Marg<strong>in</strong> (bps)<br />
YoY QoQ YoY QoQ YoY QoQ<br />
Agri Products & Chemicals (5.4) (17.5) (26.7) (15.1) (95) 239<br />
Automobiles 3.1 (15.3) (6.3) (32.3) 11 (101)<br />
Auto Ancillary (1.5) (2.3) (23.5) (10.6) (56) (71)<br />
Banks 13.5 3.4 6.4 (2.5)<br />
Capital Goods 1.7 (38.6) (3.9) (69.6) 16 (811)<br />
Cement (4.6) (6.8) (32.9) (22.6) (622) (87)<br />
Construction 8.1 (24.8) (0.7) (50.8) (43) (31)<br />
Consumer Staples 14.4 3.7 13.8 6.7 52 128<br />
F<strong>in</strong>ancial Services 23.0 (8.5) 23.7 (16.1)<br />
Information Tech. 10.9 5.1 11.5 3.4 (67) 12<br />
Metals (7.9) (17.0) (31.1) (41.0) (226) (347)<br />
Offshore, S.B. & Ports (2.9) (10.1) (21.7) (40.2) (681) 455<br />
Pharma 11.6 2.2 (91.2) (95.2) (9) 185<br />
Power 6.9 (0.7) (5.5) 5.4 76 53<br />
Real Estate 20.3 (4.6) (5.0) 161.8 (954) 447<br />
Others 7.4 (15.9) NA (61.6) 152 (411)<br />
PL Universe 3.7 (10.9) (6.2) (21.8) (18) (18)<br />
Source: Company Data, PL Research<br />
*EBITDA Marg<strong>in</strong>s are exclud<strong>in</strong>g BFSI<br />
July 8, 2013 6


