

will government's massive surge in investment ... - Myiris.com
will government's massive surge in investment ... - Myiris.com
will government's massive surge in investment ... - Myiris.com

Create successful ePaper yourself
Turn your PDF publications into a flip-book with our unique Google optimized e-Paper software.
Apr-Jun 2013 Earn<strong>in</strong>gs Preview<br />
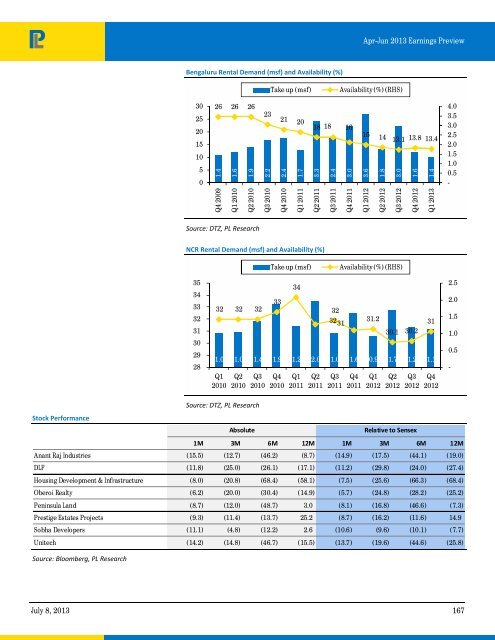
Bengaluru Rental Demand (msf) and Availability (%)<br />
Take up (msf)<br />
Availability (%) (RHS)<br />
30<br />
25<br />
20<br />
15<br />
10<br />
5<br />
0<br />
26 26 26<br />
1.4<br />
1.6<br />
1.9<br />
23<br />
2.2<br />
21 20<br />
2.4<br />
1.7<br />
18 18 16<br />
3.3<br />
2.4<br />
3.0<br />
15 14 13.1 13.8 13.4<br />
3.6<br />
1.8<br />
3.0<br />
1.6<br />
1.4<br />
4.0<br />
3.5<br />
3.0<br />
2.5<br />
2.0<br />
1.5<br />
1.0<br />
0.5<br />
-<br />
Q4 2009<br />
Q1 2010<br />
Q2 2010<br />
Q3 2010<br />
Q4 2010<br />
Q1 2011<br />
Q2 2011<br />
Q3 2011<br />
Q4 2011<br />
Q1 2012<br />
Q2 2012<br />
Q3 2012<br />
Q4 2012<br />
Q1 2013<br />
Source: DTZ, PL Research<br />
NCR Rental Demand (msf) and Availability (%)<br />
Take up (msf)<br />
Availability (%) (RHS)<br />
35<br />
34<br />
33<br />
32<br />
31<br />
30<br />
29<br />
28<br />
32 32 32<br />
33<br />
34<br />
32<br />
3231<br />
31.2<br />
30.1 30.2<br />
1.0 1.0 1.4 1.9 1.2 2.0 1.0 1.6 0.9 1.7 1.2 1.1<br />
Q1<br />
2010<br />
Q2<br />
2010<br />
Q3<br />
2010<br />
Q4<br />
2010<br />
Q1<br />
2011<br />
Q2<br />
2011<br />
Q3<br />
2011<br />
Q4<br />
2011<br />
Q1<br />
2012<br />
Q2<br />
2012<br />
Q3<br />
2012<br />
31<br />
Q4<br />
2012<br />
2.5<br />
2.0<br />
1.5<br />
1.0<br />
0.5<br />
-<br />
Source: DTZ, PL Research<br />
Stock Performance<br />
Absolute<br />
Relative to Sensex<br />
1M 3M 6M 12M 1M 3M 6M 12M<br />
Anant Raj Industries (15.5) (12.7) (46.2) (8.7) (14.9) (17.5) (44.1) (19.0)<br />
DLF (11.8) (25.0) (26.1) (17.1) (11.2) (29.8) (24.0) (27.4)<br />
Hous<strong>in</strong>g Development & Infrastructure (8.0) (20.8) (68.4) (58.1) (7.5) (25.6) (66.3) (68.4)<br />
Oberoi Realty (6.2) (20.0) (30.4) (14.9) (5.7) (24.8) (28.2) (25.2)<br />
Pen<strong>in</strong>sula Land (8.7) (12.0) (48.7) 3.0 (8.1) (16.8) (46.6) (7.3)<br />
Prestige Estates Projects (9.3) (11.4) (13.7) 25.2 (8.7) (16.2) (11.6) 14.9<br />
Sobha Developers (11.1) (4.8) (12.2) 2.6 (10.6) (9.6) (10.1) (7.7)<br />
Unitech (14.2) (14.8) (46.7) (15.5) (13.7) (19.6) (44.6) (25.8)<br />
Source: Bloomberg, PL Research<br />
July 8, 2013 167


