

will government's massive surge in investment ... - Myiris.com
will government's massive surge in investment ... - Myiris.com
will government's massive surge in investment ... - Myiris.com

Create successful ePaper yourself
Turn your PDF publications into a flip-book with our unique Google optimized e-Paper software.
Apr-Jul 2013 Earn<strong>in</strong>gs Preview<br />
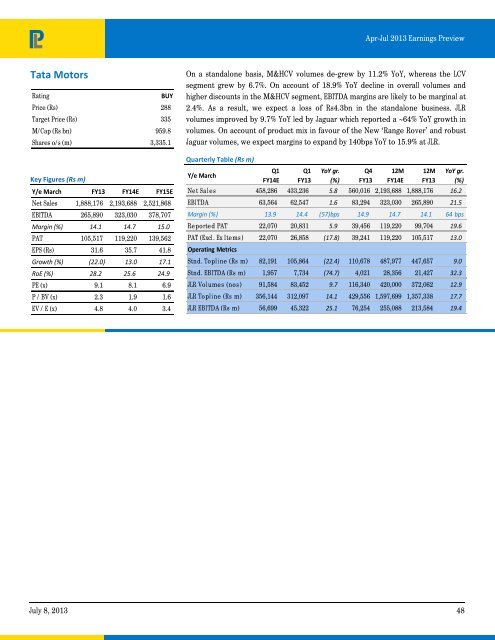
Tata Motors<br />
Rat<strong>in</strong>g<br />
BUY<br />
Price (Rs) 288<br />
Target Price (Rs) 335<br />
M/Cap (Rs bn) 959.8<br />
Shares o/s (m) 3,335.1<br />
Key Figures (Rs m)<br />
Y/e March FY13 FY14E FY15E<br />
Net Sales 1,888,176 2,193,688 2,521,868<br />
EBITDA 265,890 323,030 378,707<br />
Marg<strong>in</strong> (%) 14.1 14.7 15.0<br />
PAT 105,517 119,220 139,562<br />
EPS (Rs) 31.6 35.7 41.8<br />
Growth (%) (22.0) 13.0 17.1<br />
RoE (%) 28.2 25.6 24.9<br />
PE (x) 9.1 8.1 6.9<br />
P / BV (x) 2.3 1.9 1.6<br />
EV / E (x) 4.8 4.0 3.4<br />
On a standalone basis, M&HCV volumes de-grew by 11.2% YoY, whereas the LCV<br />
segment grew by 6.7%. On account of 18.9% YoY decl<strong>in</strong>e <strong>in</strong> overall volumes and<br />
higher discounts <strong>in</strong> the M&HCV segment, EBITDA marg<strong>in</strong>s are likely to be marg<strong>in</strong>al at<br />
2.4%. As a result, we expect a loss of Rs4.3bn <strong>in</strong> the standalone bus<strong>in</strong>ess. JLR<br />
volumes improved by 9.7% YoY led by Jaguar which reported a ~64% YoY growth <strong>in</strong><br />
volumes. On account of product mix <strong>in</strong> favour of the New ‘Range Rover’ and robust<br />
Jaguar volumes, we expect marg<strong>in</strong>s to expand by 140bps YoY to 15.9% at JLR.<br />
Quarterly Table (Rs m)<br />
Y/e March<br />
Q1<br />
FY14E<br />
Q1<br />
FY13<br />
YoY gr.<br />
(%)<br />
Q4<br />
FY13<br />
12M<br />
FY14E<br />
12M<br />
FY13<br />
YoY gr.<br />
(%)<br />
Net Sales 458,286 433,236 5.8 560,016 2,193,688 1,888,176 16.2<br />
EBITDA 63,564 62,547 1.6 83,294 323,030 265,890 21.5<br />
Marg<strong>in</strong> (%) 13.9 14.4 (57)bps 14.9 14.7 14.1 64 bps<br />
Reported PAT 22,070 20,831 5.9 39,456 119,220 99,704 19.6<br />
PAT (Excl. Ex Items ) 22,070 26,858 (17.8) 39,241 119,220 105,517 13.0<br />
Operat<strong>in</strong>g Metrics<br />
Stnd. Topl<strong>in</strong>e (Rs m) 82,191 105,864 (22.4) 110,678 487,977 447,657 9.0<br />
Stnd. EBITDA (Rs m) 1,957 7,734 (74.7) 4,021 28,356 21,427 32.3<br />
JLR Volumes (nos) 91,584 83,452 9.7 116,340 420,000 372,062 12.9<br />
JLR Topl<strong>in</strong>e (Rs m) 356,144 312,097 14.1 429,556 1,597,699 1,357,338 17.7<br />
JLR EBITDA (Rs m) 56,699 45,322 25.1 76,254 255,088 213,584 19.4<br />
July 8, 2013 48


