

will government's massive surge in investment ... - Myiris.com
will government's massive surge in investment ... - Myiris.com
will government's massive surge in investment ... - Myiris.com

Create successful ePaper yourself
Turn your PDF publications into a flip-book with our unique Google optimized e-Paper software.
Apr-Jun 2013 Earn<strong>in</strong>gs Preview<br />
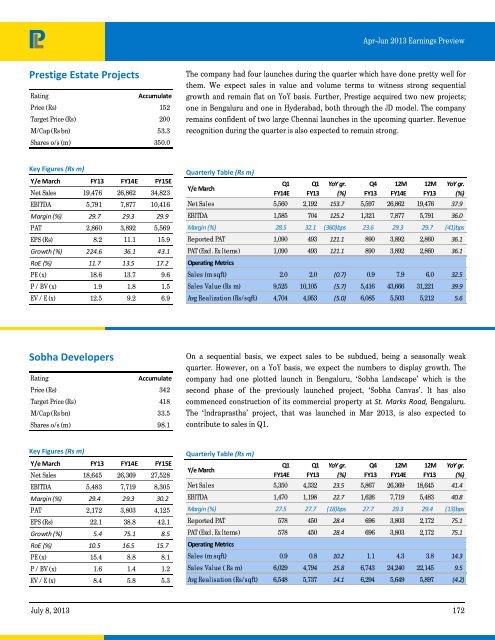
Prestige Estate Projects<br />
Rat<strong>in</strong>g<br />
Accumulate<br />
Price (Rs) 152<br />
Target Price (Rs) 200<br />
M/Cap (Rs bn) 53.3<br />
Shares o/s (m) 350.0<br />
The <strong>com</strong>pany had four launches dur<strong>in</strong>g the quarter which have done pretty well for<br />
them. We expect sales <strong>in</strong> value and volume terms to witness strong sequential<br />
growth and rema<strong>in</strong> flat on YoY basis. Further, Prestige acquired two new projects;<br />
one <strong>in</strong> Bengaluru and one <strong>in</strong> Hyderabad, both through the JD model. The <strong>com</strong>pany<br />
rema<strong>in</strong>s confident of two large Chennai launches <strong>in</strong> the up<strong>com</strong><strong>in</strong>g quarter. Revenue<br />
recognition dur<strong>in</strong>g the quarter is also expected to rema<strong>in</strong> strong.<br />
Key Figures (Rs m)<br />
Y/e March FY13 FY14E FY15E<br />
Net Sales 19,476 26,862 34,823<br />
EBITDA 5,791 7,877 10,416<br />
Marg<strong>in</strong> (%) 29.7 29.3 29.9<br />
PAT 2,860 3,892 5,569<br />
EPS (Rs) 8.2 11.1 15.9<br />
Growth (%) 224.6 36.1 43.1<br />
RoE (%) 11.7 13.5 17.2<br />
PE (x) 18.6 13.7 9.6<br />
P / BV (x) 1.9 1.8 1.5<br />
EV / E (x) 12.5 9.2 6.9<br />
Quarterly Table (Rs m)<br />
Y/e March<br />
Q1<br />
FY14E<br />
Q1<br />
FY13<br />
YoY gr.<br />
(%)<br />
Q4<br />
FY13<br />
12M<br />
FY14E<br />
12M<br />
FY13<br />
YoY gr.<br />
(%)<br />
Net Sales 5,560 2,192 153.7 5,597 26,862 19,476 37.9<br />
EBITDA 1,585 704 125.2 1,321 7,877 5,791 36.0<br />
Marg<strong>in</strong> (%) 28.5 32.1 (360)bps 23.6 29.3 29.7 (41)bps<br />
Reported PAT 1,090 493 121.1 890 3,892 2,860 36.1<br />
PAT (Excl. Ex Items) 1,090 493 121.1 890 3,892 2,860 36.1<br />
Operat<strong>in</strong>g Metrics<br />
Sales (m sqft) 2.0 2.0 (0.7) 0.9 7.9 6.0 32.5<br />
Sales Value (Rs m) 9,525 10,105 (5.7) 5,416 43,666 31,221 39.9<br />
Avg Realization (Rs/sqft) 4,704 4,953 (5.0) 6,085 5,503 5,212 5.6<br />
Sobha Developers<br />
Rat<strong>in</strong>g<br />
Accumulate<br />
Price (Rs) 342<br />
Target Price (Rs) 418<br />
M/Cap (Rs bn) 33.5<br />
Shares o/s (m) 98.1<br />
On a sequential basis, we expect sales to be subdued, be<strong>in</strong>g a seasonally weak<br />
quarter. However, on a YoY basis, we expect the numbers to display growth. The<br />
<strong>com</strong>pany had one plotted launch <strong>in</strong> Bengaluru, ‘Sobha Landscape’ which is the<br />
second phase of the previously launched project, ‘Sobha Canvas’. It has also<br />
<strong>com</strong>menced construction of its <strong>com</strong>mercial property at St. Marks Road, Bengaluru.<br />
The ‘Indraprastha’ project, that was launched <strong>in</strong> Mar 2013, is also expected to<br />
contribute to sales <strong>in</strong> Q1.<br />
Key Figures (Rs m)<br />
Y/e March FY13 FY14E FY15E<br />
Net Sales 18,645 26,369 27,528<br />
EBITDA 5,483 7,719 8,305<br />
Marg<strong>in</strong> (%) 29.4 29.3 30.2<br />
PAT 2,172 3,803 4,125<br />
EPS (Rs) 22.1 38.8 42.1<br />
Growth (%) 5.4 75.1 8.5<br />
RoE (%) 10.5 16.5 15.7<br />
PE (x) 15.4 8.8 8.1<br />
P / BV (x) 1.6 1.4 1.2<br />
EV / E (x) 8.4 5.8 5.3<br />
Quarterly Table (Rs m)<br />
Y/e March<br />
Q1<br />
FY14E<br />
Q1<br />
FY13<br />
YoY gr.<br />
(%)<br />
Q4<br />
FY13<br />
12M<br />
FY14E<br />
12M<br />
FY13<br />
YoY gr.<br />
(%)<br />
Net Sales 5,350 4,332 23.5 5,867 26,369 18,645 41.4<br />
EBITDA 1,470 1,198 22.7 1,626 7,719 5,483 40.8<br />
Marg<strong>in</strong> (%) 27.5 27.7 (18)bps 27.7 29.3 29.4 (13)bps<br />
Reported PAT 578 450 28.4 696 3,803 2,172 75.1<br />
PAT (Excl. Ex Items) 578 450 28.4 696 3,803 2,172 75.1<br />
Operat<strong>in</strong>g Metrics<br />
Sales (m sqft) 0.9 0.8 10.2 1.1 4.3 3.8 14.3<br />
Sales Value ( Rs m) 6,029 4,794 25.8 6,743 24,240 22,145 9.5<br />
Avg Realisation (Rs/sqft) 6,548 5,737 14.1 6,294 5,649 5,897 (4.2)<br />
July 8, 2013 172


