

will government's massive surge in investment ... - Myiris.com
will government's massive surge in investment ... - Myiris.com
will government's massive surge in investment ... - Myiris.com

Create successful ePaper yourself
Turn your PDF publications into a flip-book with our unique Google optimized e-Paper software.
Apr-Jun 2013 Earn<strong>in</strong>gs Preview<br />
NIFTY: Earn<strong>in</strong>gs growth and valuations<br />
Nifty EPS at Rs356.6, Rs391.4 and Rs457.0<br />
to grow at 1.4%, 9.7% and 16.8%<br />
respectively for FY13, FY14 & FY15<br />
NIFTY is currently trad<strong>in</strong>g at 16.3x FY13,<br />
14.8xFY14 and 12.7x FY15 estimated<br />
free‐float earn<strong>in</strong>gs<br />
Nifty trad<strong>in</strong>g at 1.0% discount to its tenyear<br />
average of one‐year forward multiple<br />
We estimate the free-float EPS for NIFTY <strong>com</strong>panies <strong>in</strong> FY13, FY14 and FY15 at<br />
Rs356.6, Rs391.4 and Rs457.0, respectively, represent<strong>in</strong>g a YoY growth of 1.4%, 9.7%<br />
and 16.8%, respectively. Technology (18.2% YoY growth), FMCG (14.0% YoY growth)<br />
and Auto (13.4% YoY growth) are likely to lead the charge <strong>in</strong> net profit growth <strong>in</strong><br />
FY14, while Cement (5.2% YoY growth), Metals (5.6% YoY growth) and BFSI (6.5%<br />
YoY growth) are expected to be the laggards.<br />
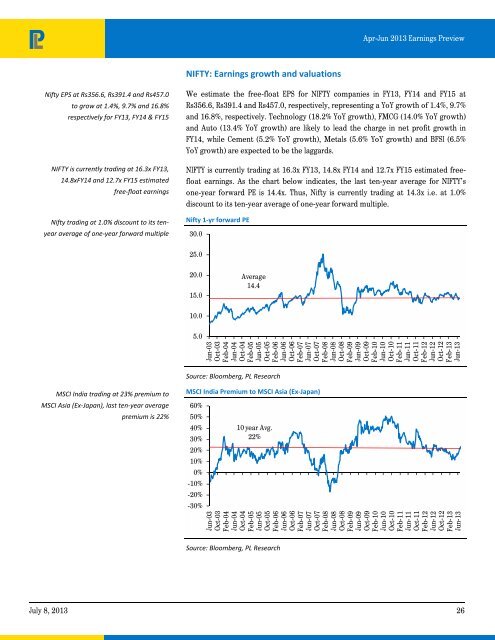
NIFTY is currently trad<strong>in</strong>g at 16.3x FY13, 14.8x FY14 and 12.7x FY15 estimated freefloat<br />
earn<strong>in</strong>gs. As the chart below <strong>in</strong>dicates, the last ten-year average for NIFTY’s<br />
one-year forward PE is 14.4x. Thus, Nifty is currently trad<strong>in</strong>g at 14.3x i.e. at 1.0%<br />
discount to its ten-year average of one-year forward multiple.<br />
Nifty 1‐yr forward PE<br />
30.0<br />
25.0<br />
20.0<br />
15.0<br />
Average<br />
14.4<br />
10.0<br />
5.0<br />
Jun-03<br />
Oct-03<br />
Feb-04<br />
Jun-04<br />
Oct-04<br />
Feb-05<br />
Jun-05<br />
Oct-05<br />
Feb-06<br />
Jun-06<br />
Oct-06<br />
Feb-07<br />
Jun-07<br />
Oct-07<br />
Feb-08<br />
Jun-08<br />
Oct-08<br />
Feb-09<br />
Jun-09<br />
Oct-09<br />
Feb-10<br />
Jun-10<br />
Oct-10<br />
Feb-11<br />
Jun-11<br />
Oct-11<br />
Feb-12<br />
Jun-12<br />
Oct-12<br />
Feb-13<br />
Jun-13<br />
Source: Bloomberg, PL Research<br />
MSCI India trad<strong>in</strong>g at 23% premium to<br />
MSCI Asia (Ex‐Japan), last ten‐year average<br />
premium is 22%<br />
MSCI India Premium to MSCI Asia (Ex‐Japan)<br />
60%<br />
50%<br />
40%<br />
30%<br />
20%<br />
10%<br />
0%<br />
-10%<br />
-20%<br />
-30%<br />
10 year Avg.<br />
22%<br />
Jun-03<br />
Oct-03<br />
Feb-04<br />
Jun-04<br />
Oct-04<br />
Feb-05<br />
Jun-05<br />
Oct-05<br />
Feb-06<br />
Jun-06<br />
Oct-06<br />
Feb-07<br />
Jun-07<br />
Oct-07<br />
Feb-08<br />
Jun-08<br />
Oct-08<br />
Feb-09<br />
Jun-09<br />
Oct-09<br />
Feb-10<br />
Jun-10<br />
Oct-10<br />
Feb-11<br />
Jun-11<br />
Oct-11<br />
Feb-12<br />
Jun-12<br />
Oct-12<br />
Feb-13<br />
Jun-13<br />
Source: Bloomberg, PL Research<br />
July 8, 2013 26


