

will government's massive surge in investment ... - Myiris.com
will government's massive surge in investment ... - Myiris.com
will government's massive surge in investment ... - Myiris.com

Create successful ePaper yourself
Turn your PDF publications into a flip-book with our unique Google optimized e-Paper software.
Apr-Jun 2013 Earn<strong>in</strong>gs Preview<br />
Complex fertilizer sales decl<strong>in</strong>ed by 60% YoY for the <strong>in</strong>dustry dur<strong>in</strong>g<br />
Apr/May’13<br />
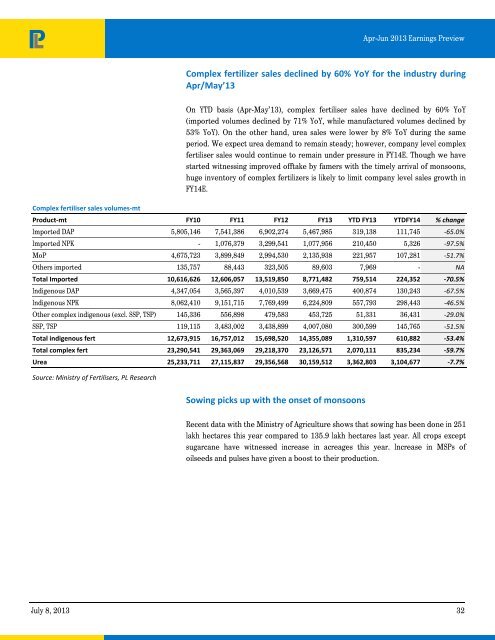
Complex fertiliser sales volumes‐mt<br />
On YTD basis (Apr-May’13), <strong>com</strong>plex fertiliser sales have decl<strong>in</strong>ed by 60% YoY<br />
(imported volumes decl<strong>in</strong>ed by 71% YoY, while manufactured volumes decl<strong>in</strong>ed by<br />
53% YoY). On the other hand, urea sales were lower by 8% YoY dur<strong>in</strong>g the same<br />
period. We expect urea demand to rema<strong>in</strong> steady; however, <strong>com</strong>pany level <strong>com</strong>plex<br />
fertiliser sales would cont<strong>in</strong>ue to rema<strong>in</strong> under pressure <strong>in</strong> FY14E. Though we have<br />
started witness<strong>in</strong>g improved offtake by famers with the timely arrival of monsoons,<br />
huge <strong>in</strong>ventory of <strong>com</strong>plex fertilizers is likely to limit <strong>com</strong>pany level sales growth <strong>in</strong><br />
FY14E.<br />
Product‐mt FY10 FY11 FY12 FY13 YTD FY13 YTDFY14 % change<br />
Imported DAP 5,805,146 7,541,386 6,902,274 5,467,985 319,138 111,745 ‐65.0%<br />
Imported NPK - 1,076,379 3,299,541 1,077,956 210,450 5,326 ‐97.5%<br />
MoP 4,675,723 3,899,849 2,994,530 2,135,938 221,957 107,281 ‐51.7%<br />
Others imported 135,757 88,443 323,505 89,603 7,969 - NA<br />
Total Imported 10,616,626 12,606,057 13,519,850 8,771,482 759,514 224,352 ‐70.5%<br />
Indigenous DAP 4,347,054 3,565,397 4,010,539 3,669,475 400,874 130,243 ‐67.5%<br />
Indigenous NPK 8,062,410 9,151,715 7,769,499 6,224,809 557,793 298,443 ‐46.5%<br />
Other <strong>com</strong>plex <strong>in</strong>digenous (excl. SSP, TSP) 145,336 556,898 479,583 453,725 51,331 36,431 ‐29.0%<br />
SSP, TSP 119,115 3,483,002 3,438,899 4,007,080 300,599 145,765 ‐51.5%<br />
Total <strong>in</strong>digenous fert 12,673,915 16,757,012 15,698,520 14,355,089 1,310,597 610,882 ‐53.4%<br />
Total <strong>com</strong>plex fert 23,290,541 29,363,069 29,218,370 23,126,571 2,070,111 835,234 ‐59.7%<br />
Urea 25,233,711 27,115,837 29,356,568 30,159,512 3,362,803 3,104,677 ‐7.7%<br />
Source: M<strong>in</strong>istry of Fertilisers, PL Research<br />
Sow<strong>in</strong>g picks up with the onset of monsoons<br />
Recent data with the M<strong>in</strong>istry of Agriculture shows that sow<strong>in</strong>g has been done <strong>in</strong> 251<br />
lakh hectares this year <strong>com</strong>pared to 135.9 lakh hectares last year. All crops except<br />
sugarcane have witnessed <strong>in</strong>crease <strong>in</strong> acreages this year. Increase <strong>in</strong> MSPs of<br />
oilseeds and pulses have given a boost to their production.<br />
July 8, 2013 32


