

will government's massive surge in investment ... - Myiris.com
will government's massive surge in investment ... - Myiris.com
will government's massive surge in investment ... - Myiris.com

You also want an ePaper? Increase the reach of your titles
YUMPU automatically turns print PDFs into web optimized ePapers that Google loves.
Apr-Jun 2013 Earn<strong>in</strong>gs Preview<br />
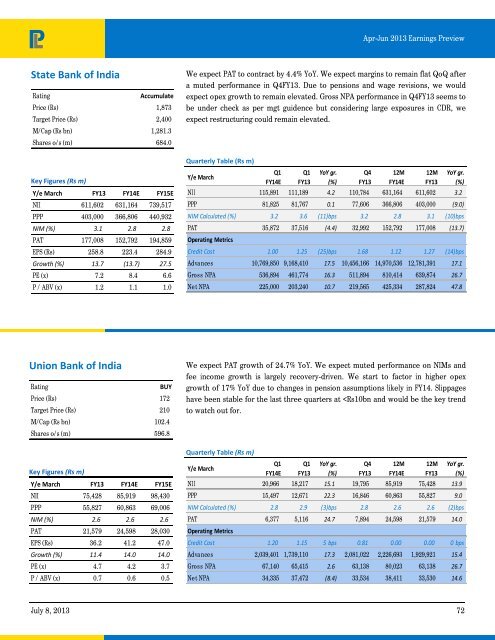
State Bank of India<br />
Rat<strong>in</strong>g<br />
Accumulate<br />
Price (Rs) 1,873<br />
Target Price (Rs) 2,400<br />
M/Cap (Rs bn) 1,281.3<br />
Shares o/s (m) 684.0<br />
Key Figures (Rs m)<br />
Y/e March FY13 FY14E FY15E<br />
NII 611,602 631,164 739,517<br />
PPP 403,000 366,806 440,932<br />
NIM (%) 3.1 2.8 2.8<br />
PAT 177,008 152,792 194,859<br />
EPS (Rs) 258.8 223.4 284.9<br />
Growth (%) 13.7 (13.7) 27.5<br />
PE (x) 7.2 8.4 6.6<br />
P / ABV (x) 1.2 1.1 1.0<br />
We expect PAT to contract by 4.4% YoY. We expect marg<strong>in</strong>s to rema<strong>in</strong> flat QoQ after<br />
a muted performance <strong>in</strong> Q4FY13. Due to pensions and wage revisions, we would<br />
expect opex growth to rema<strong>in</strong> elevated. Gross NPA performance <strong>in</strong> Q4FY13 seems to<br />
be under check as per mgt guidence but consider<strong>in</strong>g large exposures <strong>in</strong> CDR, we<br />
expect restructur<strong>in</strong>g could rema<strong>in</strong> elevated.<br />
Quarterly Table (Rs m)<br />
Y/e March<br />
Q1<br />
FY14E<br />
Q1<br />
FY13<br />
YoY gr.<br />
(%)<br />
Q4<br />
FY13<br />
12M<br />
FY14E<br />
12M<br />
FY13<br />
YoY gr.<br />
(%)<br />
NII 115,891 111,189 4.2 110,784 631,164 611,602 3.2<br />
PPP 81,825 81,767 0.1 77,606 366,806 403,000 (9.0)<br />
NIM Calculated (%) 3.2 3.6 (11)bps 3.2 2.8 3.1 (10)bps<br />
PAT 35,872 37,516 (4.4) 32,992 152,792 177,008 (13.7)<br />
Operat<strong>in</strong>g Metrics<br />
Credit Cost 1.00 1.25 (25)bps 1.68 1.12 1.27 (14)bps<br />
Advances 10,769,850 9,168,410 17.5 10,456,166 14,970,536 12,781,391 17.1<br />
Gross NPA 536,894 461,774 16.3 511,894 810,414 639,874 26.7<br />
Net NPA 225,000 203,240 10.7 219,565 425,334 287,824 47.8<br />
Union Bank of India<br />
Rat<strong>in</strong>g<br />
BUY<br />
Price (Rs) 172<br />
Target Price (Rs) 210<br />
M/Cap (Rs bn) 102.4<br />
Shares o/s (m) 596.8<br />
Key Figures (Rs m)<br />
Y/e March FY13 FY14E FY15E<br />
NII 75,428 85,919 98,430<br />
PPP 55,827 60,863 69,006<br />
NIM (%) 2.6 2.6 2.6<br />
PAT 21,579 24,598 28,030<br />
EPS (Rs) 36.2 41.2 47.0<br />
Growth (%) 11.4 14.0 14.0<br />
PE (x) 4.7 4.2 3.7<br />
P / ABV (x) 0.7 0.6 0.5<br />
We expect PAT growth of 24.7% YoY. We expect muted performance on NIMs and<br />
fee <strong>in</strong><strong>com</strong>e growth is largely recovery-driven. We start to factor <strong>in</strong> higher opex<br />
growth of 17% YoY due to changes <strong>in</strong> pension assumptions likely <strong>in</strong> FY14. Slippages<br />
have been stable for the last three quarters at


