

will government's massive surge in investment ... - Myiris.com
will government's massive surge in investment ... - Myiris.com
will government's massive surge in investment ... - Myiris.com

You also want an ePaper? Increase the reach of your titles
YUMPU automatically turns print PDFs into web optimized ePapers that Google loves.
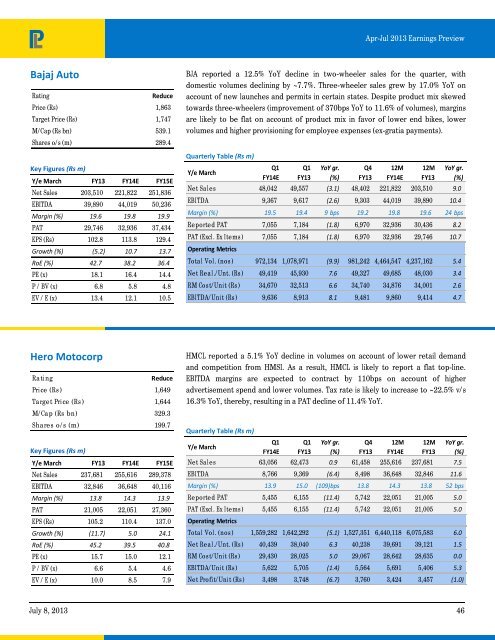
Apr-Jul 2013 Earn<strong>in</strong>gs Preview<br />
Bajaj Auto<br />
Rat<strong>in</strong>g<br />
Reduce<br />
Price (Rs) 1,863<br />
Target Price (Rs) 1,747<br />
M/Cap (Rs bn) 539.1<br />
Shares o/s (m) 289.4<br />
Key Figures (Rs m)<br />
Y/e March FY13 FY14E FY15E<br />
Net Sales 203,510 221,822 251,836<br />
EBITDA 39,890 44,019 50,236<br />
Marg<strong>in</strong> (%) 19.6 19.8 19.9<br />
PAT 29,746 32,936 37,434<br />
EPS (Rs) 102.8 113.8 129.4<br />
Growth (%) (5.2) 10.7 13.7<br />
RoE (%) 42.7 38.2 36.4<br />
PE (x) 18.1 16.4 14.4<br />
P / BV (x) 6.8 5.8 4.8<br />
EV / E (x) 13.4 12.1 10.5<br />
BJA reported a 12.5% YoY decl<strong>in</strong>e <strong>in</strong> two-wheeler sales for the quarter, with<br />
domestic volumes decl<strong>in</strong><strong>in</strong>g by ~7.7%. Three-wheeler sales grew by 17.0% YoY on<br />
account of new launches and permits <strong>in</strong> certa<strong>in</strong> states. Despite product mix skewed<br />
towards three-wheelers (improvement of 370bps YoY to 11.6% of volumes), marg<strong>in</strong>s<br />
are likely to be flat on account of product mix <strong>in</strong> favor of lower end bikes, lower<br />
volumes and higher provision<strong>in</strong>g for employee expenses (ex-gratia payments).<br />
Quarterly Table (Rs m)<br />
Y/e March<br />
Q1<br />
FY14E<br />
Q1<br />
FY13<br />
YoY gr.<br />
(%)<br />
Q4<br />
FY13<br />
12M<br />
FY14E<br />
12M<br />
FY13<br />
YoY gr.<br />
(%)<br />
Net Sales 48,042 49,557 (3.1) 48,402 221,822 203,510 9.0<br />
EBITDA 9,367 9,617 (2.6) 9,303 44,019 39,890 10.4<br />
Marg<strong>in</strong> (%) 19.5 19.4 9 bps 19.2 19.8 19.6 24 bps<br />
Reported PAT 7,055 7,184 (1.8) 6,970 32,936 30,436 8.2<br />
PAT (Excl. Ex Items) 7,055 7,184 (1.8) 6,970 32,936 29,746 10.7<br />
Operat<strong>in</strong>g Metrics<br />
Total Vol. (nos ) 972,134 1,078,971 (9.9) 981,242 4,464,547 4,237,162 5.4<br />
Net Real./Unt. (Rs) 49,419 45,930 7.6 49,327 49,685 48,030 3.4<br />
RM Cost/Unit (Rs) 34,670 32,513 6.6 34,740 34,876 34,001 2.6<br />
EBITDA/Unit (Rs) 9,636 8,913 8.1 9,481 9,860 9,414 4.7<br />
Hero Motocorp<br />
Rat<strong>in</strong>g<br />
Reduce<br />
Price (Rs ) 1,649<br />
Target Price (Rs) 1,644<br />
M/Cap (Rs bn) 329.3<br />
Shares o/s (m) 199.7<br />
Key Figures (Rs m)<br />
Y/e March FY13 FY14E FY15E<br />
Net Sales 237,681 255,616 289,378<br />
EBITDA 32,846 36,648 40,116<br />
Marg<strong>in</strong> (%) 13.8 14.3 13.9<br />
PAT 21,005 22,051 27,360<br />
EPS (Rs) 105.2 110.4 137.0<br />
Growth (%) (11.7) 5.0 24.1<br />
RoE (%) 45.2 39.5 40.8<br />
PE (x) 15.7 15.0 12.1<br />
P / BV (x) 6.6 5.4 4.6<br />
EV / E (x) 10.0 8.5 7.9<br />
HMCL reported a 5.1% YoY decl<strong>in</strong>e <strong>in</strong> volumes on account of lower retail demand<br />
and <strong>com</strong>petition from HMSI. As a result, HMCL is likely to report a flat top-l<strong>in</strong>e.<br />
EBITDA marg<strong>in</strong>s are expected to contract by 110bps on account of higher<br />
advertisement spend and lower volumes. Tax rate is likely to <strong>in</strong>crease to ~22.5% v/s<br />
16.3% YoY, thereby, result<strong>in</strong>g <strong>in</strong> a PAT decl<strong>in</strong>e of 11.4% YoY.<br />
Quarterly Table (Rs m)<br />
Y/e March<br />
Q1<br />
FY14E<br />
Q1<br />
FY13<br />
YoY gr.<br />
(%)<br />
Q4<br />
FY13<br />
12M<br />
FY14E<br />
12M<br />
FY13<br />
YoY gr.<br />
(%)<br />
Net Sales 63,056 62,473 0.9 61,458 255,616 237,681 7.5<br />
EBITDA 8,766 9,369 (6.4) 8,498 36,648 32,846 11.6<br />
Marg<strong>in</strong> (%) 13.9 15.0 (109)bps 13.8 14.3 13.8 52 bps<br />
Reported PAT 5,455 6,155 (11.4) 5,742 22,051 21,005 5.0<br />
PAT (Excl. Ex Items ) 5,455 6,155 (11.4) 5,742 22,051 21,005 5.0<br />
Operat<strong>in</strong>g Metrics<br />
Total Vol. (nos ) 1,559,282 1,642,292 (5.1) 1,527,351 6,440,118 6,075,583 6.0<br />
Net Real./Unt. (Rs ) 40,439 38,040 6.3 40,238 39,691 39,121 1.5<br />
RM Cost/Unit (Rs) 29,430 28,025 5.0 29,067 28,642 28,635 0.0<br />
EBITDA/Unit (Rs) 5,622 5,705 (1.4) 5,564 5,691 5,406 5.3<br />
Net Profit/Unit (Rs) 3,498 3,748 (6.7) 3,760 3,424 3,457 (1.0)<br />
July 8, 2013 46


