

CDOT Performance Data Business Plan - Cambridge Systematics
CDOT Performance Data Business Plan - Cambridge Systematics
CDOT Performance Data Business Plan - Cambridge Systematics

You also want an ePaper? Increase the reach of your titles
YUMPU automatically turns print PDFs into web optimized ePapers that Google loves.
<strong>CDOT</strong> <strong>Performance</strong> <strong>Data</strong> <strong>Business</strong> <strong>Plan</strong><br />
Visualization Tools to be Used<br />
As the primary purpose of the <strong>CDOT</strong> dashboard is to communicate timely<br />
performance information about the department’s activities, it is important<br />
that this information be displayed in a way that is understandable to the<br />
public and simple to interpret.<br />
Stephen Few (author of Information Dashboard Design and considered a world<br />
leader in data visualization) defines a dashboard as “a visual display of the<br />
most important information needed to achieve one or more objectives;<br />
consolidated and arranged on a single screen so the information can be<br />
monitored at a glance.”<br />
There are three types of performance-based dashboards: 1) operational,<br />
2) tactical, and 3) strategic.<br />
Operational dashboards focus on exception alerting or detailed metrics<br />
related to daily operations, and are based on real-time or transactional data.<br />
These dashboards tend to be more volatile, as data changes frequently<br />
throughout the day. However, they provide an accurate snapshot of what is<br />
happening right now.<br />
Tactical dashboards display data that is not as real-time as operational<br />
dashboards. The tactical dashboard contains an aggregated, summarized, or<br />
averaged view of data, which allows comparison against historical values,<br />
benchmarks, and goals.<br />
The strategic dashboard tracks performance against high-level objectives.<br />
These dashboards tend to summarize performance over the past month,<br />
quarter, or year.<br />
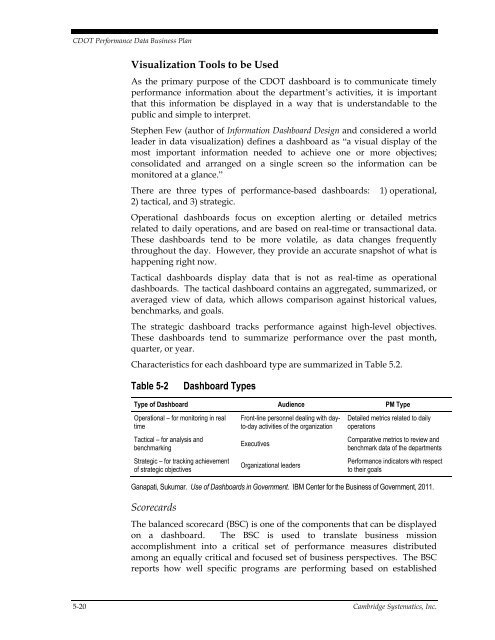
Characteristics for each dashboard type are summarized in Table 5.2.<br />
Table 5-2<br />
Dashboard Types<br />
Type of Dashboard Audience PM Type<br />
Operational – for monitoring in real<br />
time<br />
Tactical – for analysis and<br />
benchmarking<br />
Strategic – for tracking achievement<br />
of strategic objectives<br />
Front-line personnel dealing with dayto-day<br />
activities of the organization<br />
Executives<br />
Organizational leaders<br />
Detailed metrics related to daily<br />
operations<br />
Comparative metrics to review and<br />
benchmark data of the departments<br />
<strong>Performance</strong> indicators with respect<br />
to their goals<br />
Ganapati, Sukumar. Use of Dashboards in Government. IBM Center for the <strong>Business</strong> of Government, 2011.<br />
Scorecards<br />
The balanced scorecard (BSC) is one of the components that can be displayed<br />
on a dashboard. The BSC is used to translate business mission<br />
accomplishment into a critical set of performance measures distributed<br />
among an equally critical and focused set of business perspectives. The BSC<br />
reports how well specific programs are performing based on established<br />
5-20 <strong>Cambridge</strong> <strong>Systematics</strong>, Inc.


