

CDOT Performance Data Business Plan - Cambridge Systematics
CDOT Performance Data Business Plan - Cambridge Systematics
CDOT Performance Data Business Plan - Cambridge Systematics

You also want an ePaper? Increase the reach of your titles
YUMPU automatically turns print PDFs into web optimized ePapers that Google loves.
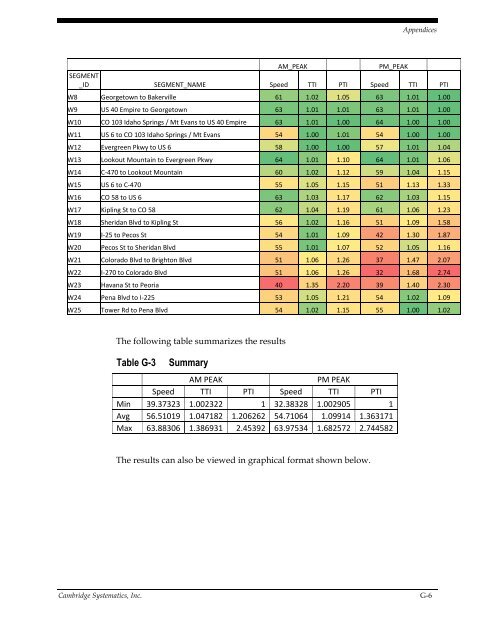
Appendices<br />
AM_PEAK<br />
PM_PEAK<br />
SEGMENT<br />
_ID SEGMENT_NAME Speed TTI PTI Speed TTI PTI<br />
W8 Georgetown to Bakerville 61 1.02 1.05 63 1.01 1.00<br />
W9 US 40 Empire to Georgetown 63 1.01 1.01 63 1.01 1.00<br />
W10 CO 103 Idaho Springs / Mt Evans to US 40 Empire 63 1.01 1.00 64 1.00 1.00<br />
W11 US 6 to CO 103 Idaho Springs / Mt Evans 54 1.00 1.01 54 1.00 1.00<br />
W12 Evergreen Pkwy to US 6 58 1.00 1.00 57 1.01 1.04<br />
W13 Lookout Mountain to Evergreen Pkwy 64 1.01 1.10 64 1.01 1.06<br />
W14 C‐470 to Lookout Mountain 60 1.02 1.12 59 1.04 1.15<br />
W15 US 6 to C‐470 55 1.05 1.15 51 1.13 1.33<br />
W16 CO 58 to US 6 63 1.03 1.17 62 1.03 1.15<br />
W17 Kipling St to CO 58 62 1.04 1.19 61 1.06 1.23<br />
W18 Sheridan Blvd to Kipling St 56 1.02 1.16 51 1.09 1.58<br />
W19 I‐25 to Pecos St 54 1.01 1.09 42 1.30 1.87<br />
W20 Pecos St to Sheridan Blvd 55 1.01 1.07 52 1.05 1.16<br />
W21 Colorado Blvd to Brighton Blvd 51 1.06 1.26 37 1.47 2.07<br />
W22 I‐270 to Colorado Blvd 51 1.06 1.26 32 1.68 2.74<br />
W23 Havana St to Peoria 40 1.35 2.20 39 1.40 2.30<br />
W24 Pena Blvd to I‐225 53 1.05 1.21 54 1.02 1.09<br />
W25 Tower Rd to Pena Blvd 54 1.02 1.15 55 1.00 1.02<br />
The following table summarizes the results<br />
Table G-3<br />
Summary<br />
AM PEAK<br />
PM PEAK<br />
Speed TTI PTI Speed TTI PTI<br />
Min 39.37323 1.002322 1 32.38328 1.002905 1<br />
Avg 56.51019 1.047182 1.206262 54.71064 1.09914 1.363171<br />
Max 63.88306 1.386931 2.45392 63.97534 1.682572 2.744582<br />
The results can also be viewed in graphical format shown below.<br />
<strong>Cambridge</strong> <strong>Systematics</strong>, Inc. G-6


