

CDOT Performance Data Business Plan - Cambridge Systematics
CDOT Performance Data Business Plan - Cambridge Systematics
CDOT Performance Data Business Plan - Cambridge Systematics

Create successful ePaper yourself
Turn your PDF publications into a flip-book with our unique Google optimized e-Paper software.
<strong>CDOT</strong> <strong>Performance</strong> <strong>Data</strong> <strong>Business</strong> <strong>Plan</strong><br />
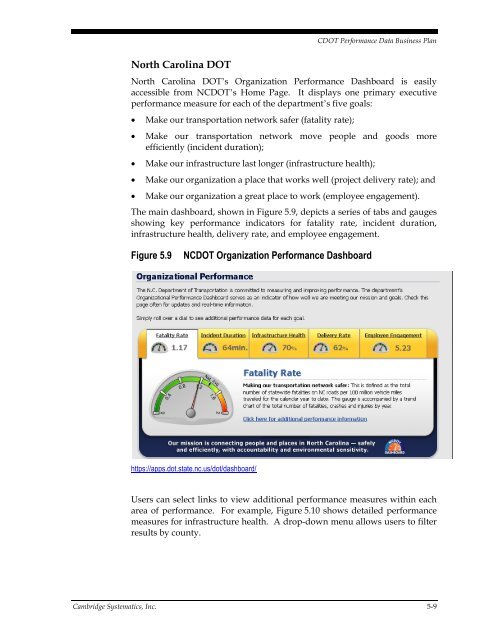
North Carolina DOT<br />
North Carolina DOT’s Organization <strong>Performance</strong> Dashboard is easily<br />
accessible from N<strong>CDOT</strong>’s Home Page. It displays one primary executive<br />
performance measure for each of the department’s five goals:<br />
<br />
<br />
<br />
<br />
<br />
Make our transportation network safer (fatality rate);<br />
Make our transportation network move people and goods more<br />
efficiently (incident duration);<br />
Make our infrastructure last longer (infrastructure health);<br />
Make our organization a place that works well (project delivery rate); and<br />
Make our organization a great place to work (employee engagement).<br />
The main dashboard, shown in Figure 5.9, depicts a series of tabs and gauges<br />
showing key performance indicators for fatality rate, incident duration,<br />
infrastructure health, delivery rate, and employee engagement.<br />
Figure 5.9<br />
N<strong>CDOT</strong> Organization <strong>Performance</strong> Dashboard<br />
https://apps.dot.state.nc.us/dot/dashboard/<br />
Users can select links to view additional performance measures within each<br />
area of performance. For example, Figure 5.10 shows detailed performance<br />
measures for infrastructure health. A drop-down menu allows users to filter<br />
results by county.<br />
<strong>Cambridge</strong> <strong>Systematics</strong>, Inc. 5-9


