

CDOT Performance Data Business Plan - Cambridge Systematics
CDOT Performance Data Business Plan - Cambridge Systematics
CDOT Performance Data Business Plan - Cambridge Systematics

Create successful ePaper yourself
Turn your PDF publications into a flip-book with our unique Google optimized e-Paper software.
<strong>CDOT</strong> <strong>Performance</strong> <strong>Data</strong> <strong>Business</strong> <strong>Plan</strong><br />
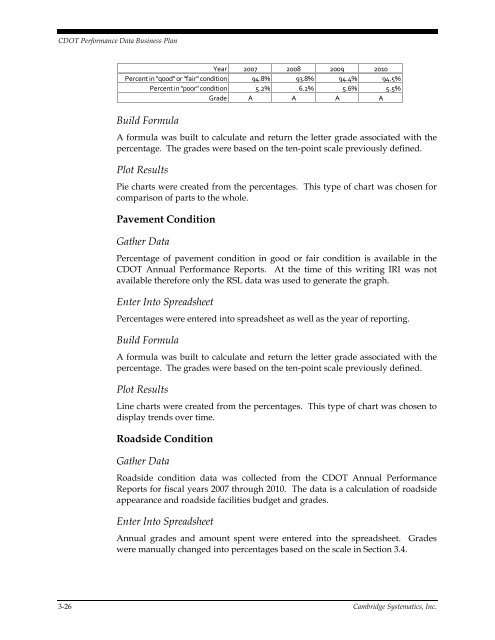
Year 2007 2008 2009 2010<br />
Percent in "good" or "fair" condition 94.8% 93.8% 94.4% 94.5%<br />
Percent in "poor" condition 5.2% 6.2% 5.6% 5.5%<br />
Grade A A A A<br />
Build Formula<br />
A formula was built to calculate and return the letter grade associated with the<br />
percentage. The grades were based on the ten-point scale previously defined.<br />
Plot Results<br />
Pie charts were created from the percentages. This type of chart was chosen for<br />
comparison of parts to the whole.<br />
Pavement Condition<br />
Gather <strong>Data</strong><br />
Percentage of pavement condition in good or fair condition is available in the<br />
<strong>CDOT</strong> Annual <strong>Performance</strong> Reports. At the time of this writing IRI was not<br />
available therefore only the RSL data was used to generate the graph.<br />
Enter Into Spreadsheet<br />
Percentages were entered into spreadsheet as well as the year of reporting.<br />
Build Formula<br />
A formula was built to calculate and return the letter grade associated with the<br />
percentage. The grades were based on the ten-point scale previously defined.<br />
Plot Results<br />
Line charts were created from the percentages. This type of chart was chosen to<br />
display trends over time.<br />
Roadside Condition<br />
Gather <strong>Data</strong><br />
Roadside condition data was collected from the <strong>CDOT</strong> Annual <strong>Performance</strong><br />
Reports for fiscal years 2007 through 2010. The data is a calculation of roadside<br />
appearance and roadside facilities budget and grades.<br />
Enter Into Spreadsheet<br />
Annual grades and amount spent were entered into the spreadsheet. Grades<br />
were manually changed into percentages based on the scale in Section 3.4.<br />
3-26 <strong>Cambridge</strong> <strong>Systematics</strong>, Inc.


