CDOT Performance Data Business Plan - Cambridge Systematics
CDOT Performance Data Business Plan - Cambridge Systematics
CDOT Performance Data Business Plan - Cambridge Systematics
You also want an ePaper? Increase the reach of your titles
YUMPU automatically turns print PDFs into web optimized ePapers that Google loves.
<strong>CDOT</strong> <strong>Performance</strong> <strong>Data</strong> <strong>Business</strong> <strong>Plan</strong><br />
Unit of Measure: Grade<br />
Calculation:<br />
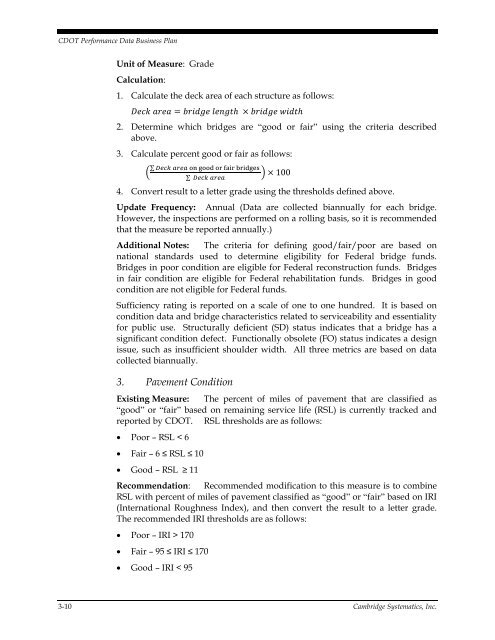
1. Calculate the deck area of each structure as follows:<br />
<br />
2. Determine which bridges are “good or fair” using the criteria described<br />
above.<br />
3. Calculate percent good or fair as follows:<br />
<br />
∑ <br />
∑ <br />
100<br />
4. Convert result to a letter grade using the thresholds defined above.<br />
Update Frequency: Annual (<strong>Data</strong> are collected biannually for each bridge.<br />
However, the inspections are performed on a rolling basis, so it is recommended<br />
that the measure be reported annually.)<br />
Additional Notes: The criteria for defining good/fair/poor are based on<br />
national standards used to determine eligibility for Federal bridge funds.<br />
Bridges in poor condition are eligible for Federal reconstruction funds. Bridges<br />
in fair condition are eligible for Federal rehabilitation funds. Bridges in good<br />
condition are not eligible for Federal funds.<br />
Sufficiency rating is reported on a scale of one to one hundred. It is based on<br />
condition data and bridge characteristics related to serviceability and essentiality<br />
for public use. Structurally deficient (SD) status indicates that a bridge has a<br />
significant condition defect. Functionally obsolete (FO) status indicates a design<br />
issue, such as insufficient shoulder width. All three metrics are based on data<br />
collected biannually.<br />
3. Pavement Condition<br />
Existing Measure: The percent of miles of pavement that are classified as<br />
“good” or “fair” based on remaining service life (RSL) is currently tracked and<br />
reported by <strong>CDOT</strong>. RSL thresholds are as follows:<br />
Poor – RSL < 6<br />
Fair – 6 ≤ RSL ≤ 10<br />
Good – RSL ≥ 11<br />
Recommendation: Recommended modification to this measure is to combine<br />
RSL with percent of miles of pavement classified as “good” or “fair” based on IRI<br />
(International Roughness Index), and then convert the result to a letter grade.<br />
The recommended IRI thresholds are as follows:<br />
Poor – IRI > 170<br />
Fair – 95 ≤ IRI ≤ 170<br />
Good – IRI < 95<br />
3-10 <strong>Cambridge</strong> <strong>Systematics</strong>, Inc.


