CDOT Performance Data Business Plan - Cambridge Systematics
CDOT Performance Data Business Plan - Cambridge Systematics
CDOT Performance Data Business Plan - Cambridge Systematics
Create successful ePaper yourself
Turn your PDF publications into a flip-book with our unique Google optimized e-Paper software.
<strong>CDOT</strong> <strong>Performance</strong> <strong>Data</strong> <strong>Business</strong> <strong>Plan</strong><br />
In addition to the issues identified in Table 3.2 a global issue is to finalize the use<br />
of a grading scale. The following sections recommend a grading scale from A to<br />
F that could be applied consistently to all measures except for number of<br />
fatalities. Other options identified throughout the course of this project include a<br />
variable grading scale that reflects differences in the measures (for example, an A<br />
for bridges might represent a higher percent of good/fair than an A for<br />
pavements), and the assignment of grades based on achievement of a long-term<br />
target value.<br />
The following sections describe the recommended measures. Details related to<br />
data and calculations are contained in Section 3.6.<br />
System <strong>Performance</strong><br />
1. Number of Fatalities (5-year moving average)<br />
Existing Measure: Number of fatalities per 100 million vehicle miles traveled<br />
is currently tracked and reported by <strong>CDOT</strong>.<br />
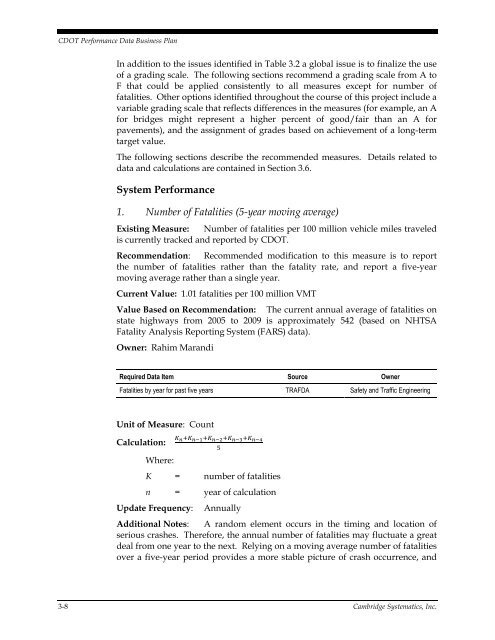
Recommendation: Recommended modification to this measure is to report<br />
the number of fatalities rather than the fatality rate, and report a five-year<br />
moving average rather than a single year.<br />
Current Value: 1.01 fatalities per 100 million VMT<br />
Value Based on Recommendation: The current annual average of fatalities on<br />
state highways from 2005 to 2009 is approximately 542 (based on NHTSA<br />
Fatality Analysis Reporting System (FARS) data).<br />
Owner: Rahim Marandi<br />
Required <strong>Data</strong> Item Source Owner<br />
Fatalities by year for past five years TRAFDA Safety and Traffic Engineering<br />
Unit of Measure: Count<br />
Calculation:<br />
Where:<br />
<br />
<br />
K = number of fatalities<br />
n = year of calculation<br />
Update Frequency:<br />
Annually<br />
Additional Notes: A random element occurs in the timing and location of<br />
serious crashes. Therefore, the annual number of fatalities may fluctuate a great<br />
deal from one year to the next. Relying on a moving average number of fatalities<br />
over a five-year period provides a more stable picture of crash occurrence, and<br />
3-8 <strong>Cambridge</strong> <strong>Systematics</strong>, Inc.


