CDOT Performance Data Business Plan - Cambridge Systematics
CDOT Performance Data Business Plan - Cambridge Systematics
CDOT Performance Data Business Plan - Cambridge Systematics
Create successful ePaper yourself
Turn your PDF publications into a flip-book with our unique Google optimized e-Paper software.
<strong>CDOT</strong> <strong>Performance</strong> <strong>Data</strong> <strong>Business</strong> <strong>Plan</strong><br />
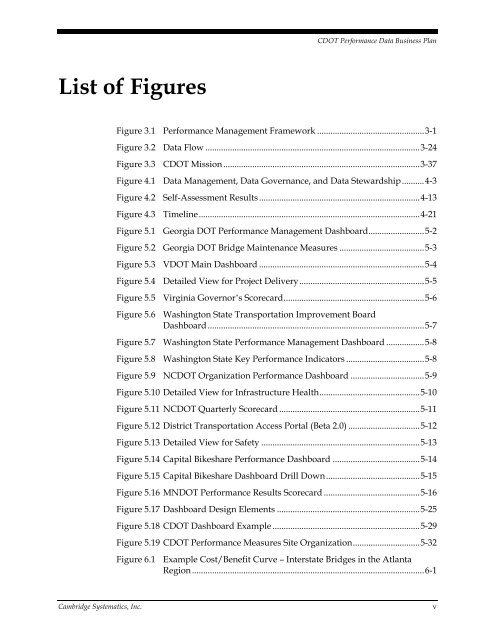
List of Figures<br />
Figure 3.1 <strong>Performance</strong> Management Framework ................................................ 3-1<br />
Figure 3.2 <strong>Data</strong> Flow ................................................................................................ 3-24<br />
Figure 3.3 <strong>CDOT</strong> Mission ........................................................................................ 3-37<br />
Figure 4.1 <strong>Data</strong> Management, <strong>Data</strong> Governance, and <strong>Data</strong> Stewardship .......... 4-3<br />
Figure 4.2 Self-Assessment Results ........................................................................ 4-13<br />
Figure 4.3 Timeline ................................................................................................... 4-21<br />
Figure 5.1 Georgia DOT <strong>Performance</strong> Management Dashboard ......................... 5-2<br />
Figure 5.2 Georgia DOT Bridge Maintenance Measures ...................................... 5-3<br />
Figure 5.3 VDOT Main Dashboard .......................................................................... 5-4<br />
Figure 5.4 Detailed View for Project Delivery ........................................................ 5-5<br />
Figure 5.5 Virginia Governor’s Scorecard ............................................................... 5-6<br />
Figure 5.6 Washington State Transportation Improvement Board<br />
Dashboard ................................................................................................. 5-7<br />
Figure 5.7 Washington State <strong>Performance</strong> Management Dashboard ................. 5-8<br />
Figure 5.8 Washington State Key <strong>Performance</strong> Indicators ................................... 5-8<br />
Figure 5.9 N<strong>CDOT</strong> Organization <strong>Performance</strong> Dashboard ................................. 5-9<br />
Figure 5.10 Detailed View for Infrastructure Health ............................................. 5-10<br />
Figure 5.11 N<strong>CDOT</strong> Quarterly Scorecard ............................................................... 5-11<br />
Figure 5.12 District Transportation Access Portal (Beta 2.0) ................................ 5-12<br />
Figure 5.13 Detailed View for Safety ....................................................................... 5-13<br />
Figure 5.14 Capital Bikeshare <strong>Performance</strong> Dashboard ....................................... 5-14<br />
Figure 5.15 Capital Bikeshare Dashboard Drill Down .......................................... 5-15<br />
Figure 5.16 MNDOT <strong>Performance</strong> Results Scorecard ........................................... 5-16<br />
Figure 5.17 Dashboard Design Elements ................................................................ 5-25<br />
Figure 5.18 <strong>CDOT</strong> Dashboard Example .................................................................. 5-29<br />
Figure 5.19 <strong>CDOT</strong> <strong>Performance</strong> Measures Site Organization .............................. 5-32<br />
Figure 6.1 Example Cost/Benefit Curve – Interstate Bridges in the Atlanta<br />
Region ........................................................................................................ 6-1<br />
<strong>Cambridge</strong> <strong>Systematics</strong>, Inc.<br />
v


