

CDOT Performance Data Business Plan - Cambridge Systematics
CDOT Performance Data Business Plan - Cambridge Systematics
CDOT Performance Data Business Plan - Cambridge Systematics

Create successful ePaper yourself
Turn your PDF publications into a flip-book with our unique Google optimized e-Paper software.
<strong>CDOT</strong> <strong>Performance</strong> <strong>Data</strong> <strong>Business</strong> <strong>Plan</strong><br />
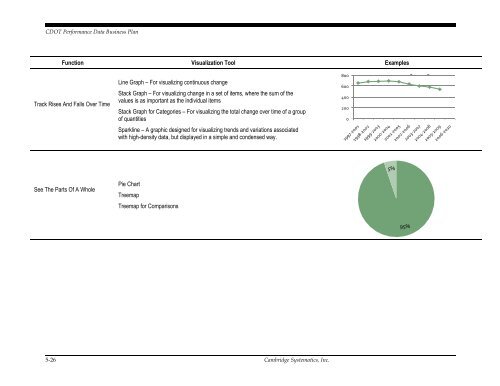
Function Visualization Tool Examples<br />
Track Rises And Falls Over Time<br />
Line Graph – For visualizing continuous change<br />
Stack Graph – For visualizing change in a set of items, where the sum of the<br />
values is as important as the individual items<br />
Stack Graph for Categories – For visualizing the total change over time of a group<br />
of quantities<br />
Sparkline – A graphic designed for visualizing trends and variations associated<br />
with high-density data, but displayed in a simple and condensed way.<br />
800<br />
600<br />
400<br />
200<br />
0<br />
g<br />
g<br />
5%<br />
See The Parts Of A Whole<br />
Pie Chart<br />
Treemap<br />
Treemap for Comparisons<br />
95%<br />
5-26 <strong>Cambridge</strong> <strong>Systematics</strong>, Inc.


