

CDOT Performance Data Business Plan - Cambridge Systematics
CDOT Performance Data Business Plan - Cambridge Systematics
CDOT Performance Data Business Plan - Cambridge Systematics

You also want an ePaper? Increase the reach of your titles
YUMPU automatically turns print PDFs into web optimized ePapers that Google loves.
<strong>CDOT</strong> <strong>Performance</strong> <strong>Data</strong> <strong>Business</strong> <strong>Plan</strong><br />
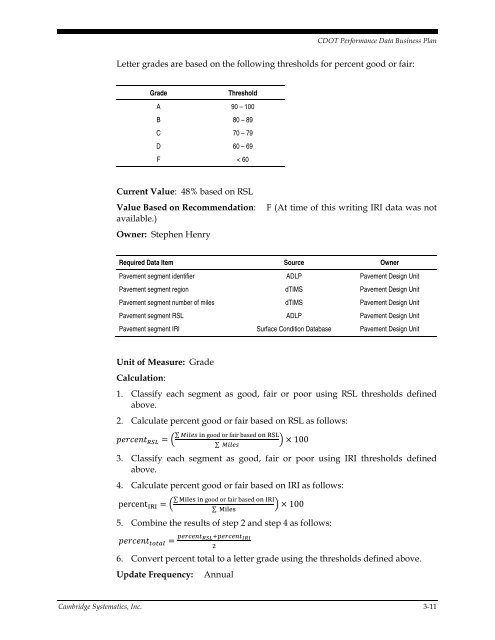
Letter grades are based on the following thresholds for percent good or fair:<br />
Grade<br />
Threshold<br />
A 90 – 100<br />
B 80 – 89<br />
C 70 – 79<br />
D 60 – 69<br />
F < 60<br />
Current Value: 48% based on RSL<br />
Value Based on Recommendation:<br />
available.)<br />
Owner: Stephen Henry<br />
F (At time of this writing IRI data was not<br />
Required <strong>Data</strong> Item Source Owner<br />
Pavement segment identifier ADLP Pavement Design Unit<br />
Pavement segment region dTIMS Pavement Design Unit<br />
Pavement segment number of miles dTIMS Pavement Design Unit<br />
Pavement segment RSL ADLP Pavement Design Unit<br />
Pavement segment IRI Surface Condition <strong>Data</strong>base Pavement Design Unit<br />
Unit of Measure: Grade<br />
Calculation:<br />
1. Classify each segment as good, fair or poor using RSL thresholds defined<br />
above.<br />
2. Calculate percent good or fair based on RSL as follows:<br />
<br />
∑ good or fair based RSL<br />
∑ <br />
100<br />
3. Classify each segment as good, fair or poor using IRI thresholds defined<br />
above.<br />
4. Calculate percent good or fair based on IRI as follows:<br />
percent IRI <br />
∑ M good or fair based IRI<br />
∑ M<br />
100<br />
5. Combine the results of step 2 and step 4 as follows:<br />
<br />
<br />
6. Convert percent total to a letter grade using the thresholds defined above.<br />
Update Frequency:<br />
Annual<br />
<strong>Cambridge</strong> <strong>Systematics</strong>, Inc. 3-11


