

CDOT Performance Data Business Plan - Cambridge Systematics
CDOT Performance Data Business Plan - Cambridge Systematics
CDOT Performance Data Business Plan - Cambridge Systematics

Create successful ePaper yourself
Turn your PDF publications into a flip-book with our unique Google optimized e-Paper software.
<strong>CDOT</strong> <strong>Performance</strong> <strong>Data</strong> <strong>Business</strong> <strong>Plan</strong><br />
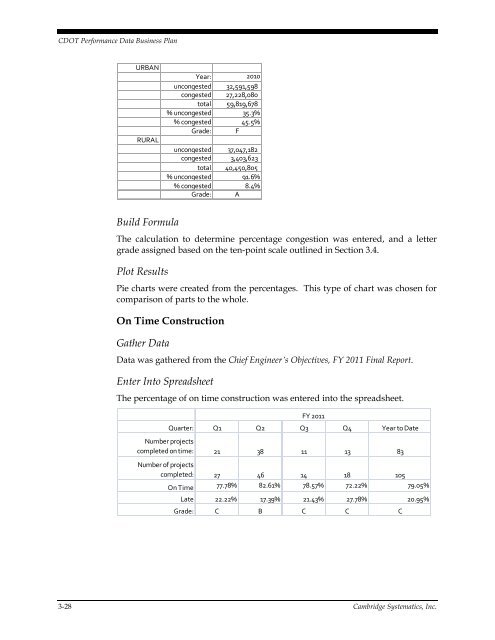
URBAN<br />
RURAL<br />
Year: 2010<br />
uncongested 32,591,598<br />
congested 27,228,080<br />
total 59,819,678<br />
% uncongested 35.3%<br />
% congested 45.5%<br />
Grade: F<br />
uncongested 37,047,182<br />
congested 3,403,623<br />
total 40,450,805<br />
% uncongested 91.6%<br />
% congested 8.4%<br />
Grade: A<br />
Build Formula<br />
The calculation to determine percentage congestion was entered, and a letter<br />
grade assigned based on the ten-point scale outlined in Section 3.4.<br />
Plot Results<br />
Pie charts were created from the percentages. This type of chart was chosen for<br />
comparison of parts to the whole.<br />
On Time Construction<br />
Gather <strong>Data</strong><br />
<strong>Data</strong> was gathered from the Chief Engineer’s Objectives, FY 2011 Final Report.<br />
Enter Into Spreadsheet<br />
The percentage of on time construction was entered into the spreadsheet.<br />
FY 2011<br />
Quarter: Q1 Q2 Q3 Q4 Year to Date<br />
Number projects<br />
completed on time: 21 38 11 13 83<br />
Number of projects<br />
completed: 27 46 14 18 105<br />
On Time 77.78% 82.61% 78.57% 72.22% 79.05%<br />
Late 22.22% 17.39% 21.43% 27.78% 20.95%<br />
Grade: C B C C C<br />
3-28 <strong>Cambridge</strong> <strong>Systematics</strong>, Inc.


