

CDOT Performance Data Business Plan - Cambridge Systematics
CDOT Performance Data Business Plan - Cambridge Systematics
CDOT Performance Data Business Plan - Cambridge Systematics

You also want an ePaper? Increase the reach of your titles
YUMPU automatically turns print PDFs into web optimized ePapers that Google loves.
<strong>CDOT</strong> <strong>Performance</strong> <strong>Data</strong> <strong>Business</strong> <strong>Plan</strong><br />
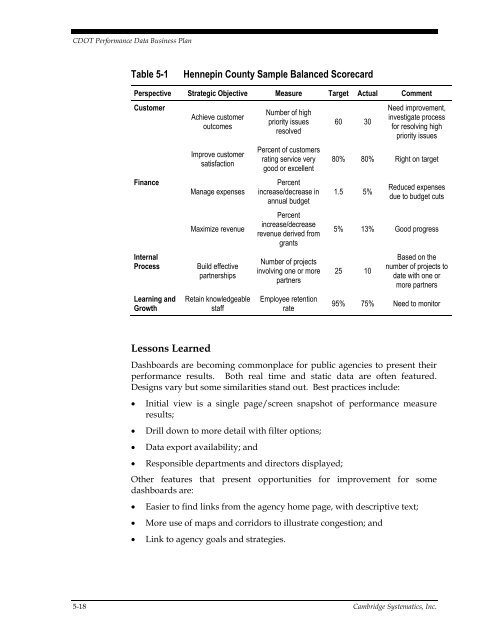
Table 5-1<br />
Hennepin County Sample Balanced Scorecard<br />
Perspective Strategic Objective Measure Target Actual Comment<br />
Customer<br />
Finance<br />
Internal<br />
Process<br />
Learning and<br />
Growth<br />
Achieve customer<br />
outcomes<br />
Improve customer<br />
satisfaction<br />
Manage expenses<br />
Maximize revenue<br />
Build effective<br />
partnerships<br />
Retain knowledgeable<br />
staff<br />
Number of high<br />
priority issues<br />
resolved<br />
Percent of customers<br />
rating service very<br />
good or excellent<br />
Percent<br />
increase/decrease in<br />
annual budget<br />
Percent<br />
increase/decrease<br />
revenue derived from<br />
grants<br />
Number of projects<br />
involving one or more<br />
partners<br />
Employee retention<br />
rate<br />
60 30<br />
Need improvement,<br />
investigate process<br />
for resolving high<br />
priority issues<br />
80% 80% Right on target<br />
1.5 5%<br />
Reduced expenses<br />
due to budget cuts<br />
5% 13% Good progress<br />
25 10<br />
Based on the<br />
number of projects to<br />
date with one or<br />
more partners<br />
95% 75% Need to monitor<br />
Lessons Learned<br />
Dashboards are becoming commonplace for public agencies to present their<br />
performance results. Both real time and static data are often featured.<br />
Designs vary but some similarities stand out. Best practices include:<br />
<br />
<br />
<br />
<br />
Initial view is a single page/screen snapshot of performance measure<br />
results;<br />
Drill down to more detail with filter options;<br />
<strong>Data</strong> export availability; and<br />
Responsible departments and directors displayed;<br />
Other features that present opportunities for improvement for some<br />
dashboards are:<br />
<br />
<br />
<br />
Easier to find links from the agency home page, with descriptive text;<br />
More use of maps and corridors to illustrate congestion; and<br />
Link to agency goals and strategies.<br />
5-18 <strong>Cambridge</strong> <strong>Systematics</strong>, Inc.


