

CDOT Performance Data Business Plan - Cambridge Systematics
CDOT Performance Data Business Plan - Cambridge Systematics
CDOT Performance Data Business Plan - Cambridge Systematics

Create successful ePaper yourself
Turn your PDF publications into a flip-book with our unique Google optimized e-Paper software.
<strong>CDOT</strong> <strong>Performance</strong> <strong>Data</strong> <strong>Business</strong> <strong>Plan</strong><br />
6.0 Cost/Benefit Curves for Safety<br />
and Mobility<br />
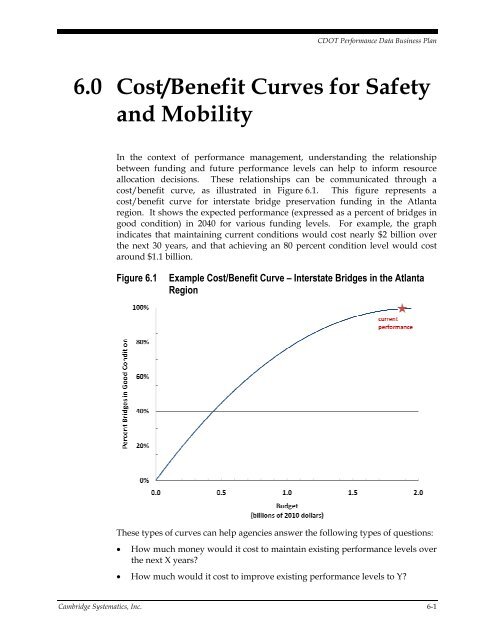
In the context of performance management, understanding the relationship<br />
between funding and future performance levels can help to inform resource<br />
allocation decisions. These relationships can be communicated through a<br />
cost/benefit curve, as illustrated in Figure 6.1. This figure represents a<br />
cost/benefit curve for interstate bridge preservation funding in the Atlanta<br />
region. It shows the expected performance (expressed as a percent of bridges in<br />
good condition) in 2040 for various funding levels. For example, the graph<br />
indicates that maintaining current conditions would cost nearly $2 billion over<br />
the next 30 years, and that achieving an 80 percent condition level would cost<br />
around $1.1 billion.<br />
Figure 6.1<br />
Example Cost/Benefit Curve – Interstate Bridges in the Atlanta<br />
Region<br />
These types of curves can help agencies answer the following types of questions:<br />
<br />
How much money would it cost to maintain existing performance levels over<br />
the next X years?<br />
How much would it cost to improve existing performance levels to Y?<br />
<strong>Cambridge</strong> <strong>Systematics</strong>, Inc. 6-1


