

CDOT Performance Data Business Plan - Cambridge Systematics
CDOT Performance Data Business Plan - Cambridge Systematics
CDOT Performance Data Business Plan - Cambridge Systematics

You also want an ePaper? Increase the reach of your titles
YUMPU automatically turns print PDFs into web optimized ePapers that Google loves.
<strong>CDOT</strong> <strong>Performance</strong> <strong>Data</strong> <strong>Business</strong> <strong>Plan</strong><br />
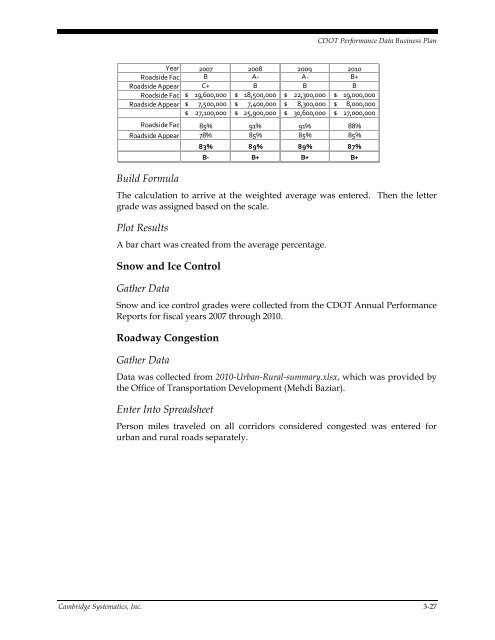
Year 2007 2008 2009 2010<br />
Roadside Fac B A‐ A‐ B+<br />
Roadside Appear C+ B B B<br />
Roadside Fac $ 19,600,000 $ 18,500,000 $ 22,300,000 $ 19,000,000<br />
Roadside Appear $ 7,500,000 $ 7,400,000 $ 8,300,000 $ 8,000,000<br />
$ 27,100,000 $ 25,900,000 $ 30,600,000 $ 27,000,000<br />
Roadside Fac 85% 91% 91% 88%<br />
Roadside Appear 78% 85% 85% 85%<br />
83% 89% 89% 87%<br />
B‐ B+ B+ B+<br />
Build Formula<br />
The calculation to arrive at the weighted average was entered. Then the letter<br />
grade was assigned based on the scale.<br />
Plot Results<br />
A bar chart was created from the average percentage.<br />
Snow and Ice Control<br />
Gather <strong>Data</strong><br />
Snow and ice control grades were collected from the <strong>CDOT</strong> Annual <strong>Performance</strong><br />
Reports for fiscal years 2007 through 2010.<br />
Roadway Congestion<br />
Gather <strong>Data</strong><br />
<strong>Data</strong> was collected from 2010-Urban-Rural-summary.xlsx, which was provided by<br />
the Office of Transportation Development (Mehdi Baziar).<br />
Enter Into Spreadsheet<br />
Person miles traveled on all corridors considered congested was entered for<br />
urban and rural roads separately.<br />
<strong>Cambridge</strong> <strong>Systematics</strong>, Inc. 3-27


