

CDOT Performance Data Business Plan - Cambridge Systematics
CDOT Performance Data Business Plan - Cambridge Systematics
CDOT Performance Data Business Plan - Cambridge Systematics

Create successful ePaper yourself
Turn your PDF publications into a flip-book with our unique Google optimized e-Paper software.
<strong>CDOT</strong> <strong>Performance</strong> <strong>Data</strong> <strong>Business</strong> <strong>Plan</strong><br />
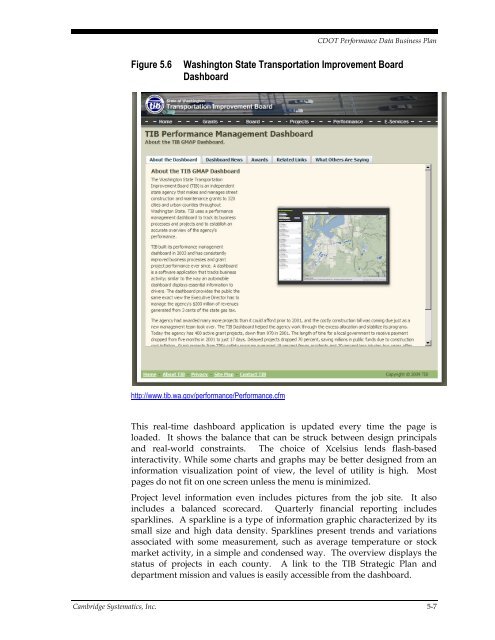
Figure 5.6<br />
Washington State Transportation Improvement Board<br />
Dashboard<br />
http://www.tib.wa.gov/performance/<strong>Performance</strong>.cfm<br />
This real-time dashboard application is updated every time the page is<br />
loaded. It shows the balance that can be struck between design principals<br />
and real-world constraints. The choice of Xcelsius lends flash-based<br />
interactivity. While some charts and graphs may be better designed from an<br />
information visualization point of view, the level of utility is high. Most<br />
pages do not fit on one screen unless the menu is minimized.<br />
Project level information even includes pictures from the job site. It also<br />
includes a balanced scorecard. Quarterly financial reporting includes<br />
sparklines. A sparkline is a type of information graphic characterized by its<br />
small size and high data density. Sparklines present trends and variations<br />
associated with some measurement, such as average temperature or stock<br />
market activity, in a simple and condensed way. The overview displays the<br />
status of projects in each county. A link to the TIB Strategic <strong>Plan</strong> and<br />
department mission and values is easily accessible from the dashboard.<br />
<strong>Cambridge</strong> <strong>Systematics</strong>, Inc. 5-7


