STX Signal Transmitter Installation and Operation ... - Kistler-Morse
STX Signal Transmitter Installation and Operation ... - Kistler-Morse
STX Signal Transmitter Installation and Operation ... - Kistler-Morse

Create successful ePaper yourself
Turn your PDF publications into a flip-book with our unique Google optimized e-Paper software.
Qlfy (qualify)<br />
Qlfy is the triggering number of successive<br />
signals above or below the median signal<br />
value, but within the Step window. In example<br />
2 in Figure 8-2, Qlfy is 3. When the third<br />
successive signal above the median (but<br />
within the Step window) is detected, the <strong>STX</strong><br />
moves the location of the median value to that<br />
point (or a percentage of the distance from the<br />
old median as determined by DSPfact). This<br />
allows the <strong>STX</strong> to respond to definite trends in<br />
weight changes. The default is 3.<br />
DSPfact (DSP factor)<br />
DSPfact determines the magnitude of change<br />
from the old to the new reference median, for<br />
change triggered by Qlfy. In Figure 8-2<br />
example 2, the <strong>STX</strong> moves the reference<br />
median 80% of the distance from the old<br />
median to the last signal (which triggered the<br />
change), based on a DSPfact of 80%. A value<br />
of 100% sets the new median to the last<br />
signal value; a value of 50% sets the new<br />
median halfway between the old median <strong>and</strong><br />
the last signal value. Note that DSPfact does<br />
not affect the change caused by a signal<br />
falling outside the Step window, as shown in<br />
example 1 in Figure 8-2. The default is 80%.<br />
Trk (track)<br />
Tracking provides the ability to reject sensor<br />
drift <strong>and</strong> other related long-term errors while<br />
preserving the displayed <strong>and</strong> output weight’s<br />
stability <strong>and</strong> accuracy. Discrimination between<br />
material movement <strong>and</strong> sensor drift is accomplished<br />
by calculating the rate of change of<br />
Chapter 8. MVS-<strong>STX</strong> Service Menu<br />
the sensor input signal every ten seconds,<br />
<strong>and</strong> comparing this rate to a user-defined<br />
threshold rate. The <strong>STX</strong> stops tracking when<br />
the rate of change exceeds the threshold<br />
rate, indicating that material is actually<br />
moving. Additionally, discrimination between<br />
slow material loss (such as from a leak) or<br />
gain <strong>and</strong> sensor drift is accomplished by<br />
comparing the total drift to a drift limit. The<br />
<strong>STX</strong> limits the maximum correction to this<br />
limit, so tracking does not mask real material<br />
loss/gain. There are two aspects to tracking<br />
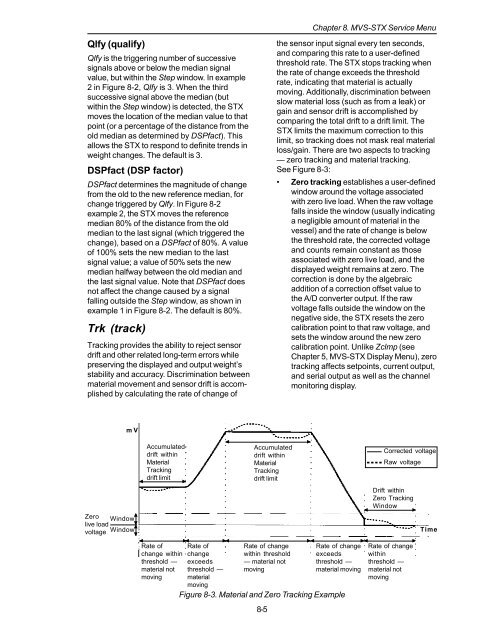
— zero tracking <strong>and</strong> material tracking.<br />
See Figure 8-3:<br />
• Zero tracking establishes a user-defined<br />
window around the voltage associated<br />
with zero live load. When the raw voltage<br />
falls inside the window (usually indicating<br />
a negligible amount of material in the<br />
vessel) <strong>and</strong> the rate of change is below<br />
the threshold rate, the corrected voltage<br />
<strong>and</strong> counts remain constant as those<br />
associated with zero live load, <strong>and</strong> the<br />
displayed weight remains at zero. The<br />
correction is done by the algebraic<br />
addition of a correction offset value to<br />
the A/D converter output. If the raw<br />
voltage falls outside the window on the<br />
negative side, the <strong>STX</strong> resets the zero<br />
calibration point to that raw voltage, <strong>and</strong><br />
sets the window around the new zero<br />
calibration point. Unlike Zclmp (see<br />
Chapter 5, MVS-<strong>STX</strong> Display Menu), zero<br />
tracking affects setpoints, current output,<br />
<strong>and</strong> serial output as well as the channel<br />
monitoring display.<br />
mV<br />
Zero Window<br />
live load<br />
voltage Window<br />
Accumulated<br />
drift within<br />
Material<br />
Tracking<br />
drift limit<br />
Accumulated<br />
drift within<br />
Material<br />
Tracking<br />
drift limit<br />
Corrected voltage<br />
Raw voltage<br />
Drift within<br />
Zero Tracking<br />
Window<br />
Time<br />
Rate of<br />
change within<br />
threshold —<br />
material not<br />
moving<br />
Rate of<br />
Rate of change<br />
change<br />
within threshold<br />
exceeds — material not<br />
threshold — moving<br />
material<br />
moving<br />
Figure 8-3. Material <strong>and</strong> Zero Tracking Example<br />
8-5<br />
Rate of change<br />
exceeds<br />
threshold —<br />
material moving<br />
Rate of change<br />
within<br />
threshold —<br />
material not<br />
moving