RA 00048.pdf - OAR@ICRISAT
RA 00048.pdf - OAR@ICRISAT
RA 00048.pdf - OAR@ICRISAT

Create successful ePaper yourself
Turn your PDF publications into a flip-book with our unique Google optimized e-Paper software.
Index<br />
350<br />
340<br />
330<br />
320<br />
3 1 0<br />
3 0 0<br />
2 9 0<br />
2 8 0<br />
270<br />
260<br />
40%<br />
260<br />
20%<br />
Feb May Aug Nov<br />
Months<br />
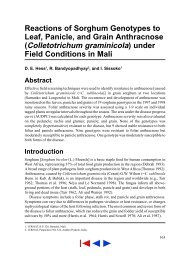
Figure 4. Average monthly detrended index<br />
prices of sorghum in India (1970-76)<br />
and percentage of sorghum arrivals to<br />
the market (1970-76).<br />
Rural D e v e l o p m e n t D e p a r t m e n t of the W o r l d<br />
Bank, W a s h i n g t o n , D. C. 20433, U.S.A. His<br />
research indicates that Indian s o r g h u m producers<br />
respond rather strongly to s o r g h u m prices w i t h<br />
elasticities ranging f r o m 0.2 to 0.8, depending<br />
upon w h i c h m e t h o d of estimation is used. Thus,<br />
e v e n t h o u g h t h e m a r k e t e d portion of s o r g h u m<br />
p r o d u c e d in India m a y be low, farmers appear to<br />
be w e l l a w a r e of s o r g h u m prices and actually<br />
respond quite strongly to its changes.<br />
Quality of Sorghum Grain as a<br />
Determinant of Price<br />
On any given market day, prices of s o r g h u m m a y<br />
vary w i t h i n a range of s o m e t i m e s 1 5 % or m o r e<br />
around the average price. The price differences<br />
are caused by differences in t h e quality mix of<br />
m a r k e t arrivals. S o m e qualities are positively and<br />
others are negatively related to price. Using<br />
multiple regression analysis, t h e variation in price<br />
d u e to quality can be e s t i m a t e d (von O p p e n and<br />
Rao 1982). Not only evident qualities but also<br />
cryptic qualities are f o u n d to have a statistically<br />
significant influence on price. A m o n g the evident<br />
qualities, red color and m o l d e d grain negatively<br />
influence price; also hundred-seed-weight positively<br />
affects price. A m o n g t h e cryptic qualities,<br />
dry v o l u m e and protein c o n t e n t positively influe<br />
n c e price and t h e absence of swelling capacity<br />
negatively influences price.<br />
S o r g h u m<br />
S o r g h u m fodder is an important source of animal<br />
f e e d in India. M o s t of t h e s t r a w is u s e d for<br />
on-farm c o n s u m p t i o n . However, excess quantities<br />
are sold in urban fodder markets. For a better<br />
understanding of the functioning of such urban<br />
fodder markets, these w e r e studied in t h e city of<br />
Hyderabad.<br />
The fodder markets in Hyderabad are not<br />
organized or regulated as are the major grain<br />
markets in Hyderabad and e l s e w h e r e in India. The<br />
transactions are not officially recorded. The market<br />
yard is a piece of land belonging to a group of<br />
persons w h o also act as c o m m i s s i o n agents.<br />
Fodder is brought to these markets in cartloads<br />
f r o m<br />
neighboring villages f r o m a distance of<br />
1 5 - 7 0 k m , and s o m e t i m e s in trucks f r o m distances<br />
of 300 km or more.<br />
The m o d e of transaction is quite simple. Fodder<br />
is sold on a per cart basis; one cart contains about<br />
100 bundles. The seller displays a f e w bundles of<br />
his s t r a w for the buyer to inspect. O t h e r than in<br />
grain markets, there are no auctions in t h e fodder<br />
market and the c o m m i s s i o n agent (the o w n e r of<br />
t h e market place) proposes a price to t h e satisfaction<br />
of the buyer and the seller.<br />
Seasonal Variation in Prices<br />
The seasonal variation in s o r g h u m fodder prices is<br />
depicted in Figure 7. Sorghum stalk is divided into<br />
five varieties that are c o m m o n l y f o u n d in t h e<br />
m a r k e t (besides HYV sorghum). For all t h e<br />
varieties of s o r g h u m , fodder prices are high during<br />
t h e m o n t h s of May, June, and July. During t h e<br />
postharvest m o n t h s of November, D e c e m b e r ,<br />
and January, prices are very low. The graph also<br />
s h o w s that the variation in fodder prices w a s<br />
higher in 1977 than in 1978. The reason is that<br />
f r o m January 1978 fodder supplies began to be<br />
d r a w n f r o m a w i d e r radius, i.e., as far as Kurnool<br />
and Cuddapah districts, w h i c h are 300 km a w a y<br />
f r o m Hyderabad.<br />
F o d d e r M a r k e t s<br />
Spatial Variation of<br />
Sorghum Straw Prices<br />
As already m e n t i o n e d , s o r g h u m s t r a w is brought<br />
f r o m neighboring villages. If price differences per<br />
6 6 9