RA 00048.pdf - OAR@ICRISAT
RA 00048.pdf - OAR@ICRISAT
RA 00048.pdf - OAR@ICRISAT

You also want an ePaper? Increase the reach of your titles
YUMPU automatically turns print PDFs into web optimized ePapers that Google loves.
trated by a linear p r o g r a m m i n g analysis I perf<br />
o r m e d using s o m e factorial e x p e r i m e n t s c o n -<br />
d u c t e d by t h e All India Coordinated Research<br />
Project for Dryland Agriculture. There w e r e four<br />
technique choices possible, each having different<br />
costs and profits (Table 6). Land w a s limited to 5<br />
ha and o p t i m u m plans w e r e calculated for various<br />
a m o u n t s of w o r k i n g capital available to a farmer to<br />
invest in his land. No other constraints w e r e<br />
i m p o s e d . Only after t h e f a r m e r had access to<br />
m o r e than Rs. 1000 of w o r k i n g capital (Rs.<br />
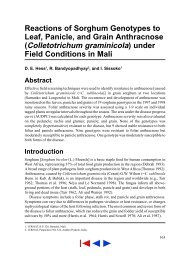
2 0 0 / h a ) did t h e solution to t h e p r o b l e m indicate<br />
that it w a s desirable to apply fertilizers to t h e<br />
C S H - 1 hybrid s o r g h u m (Fig. 2). If Rs. 1000 or less<br />
w e r e available, C S H - 1 w i t h local inputs w a s only<br />
c h o s e n . The balance of land w h i c h could not be<br />
s o w n t o C S H - 1 d u e t o shortage o f capital i n s u c h<br />
instances, w o u l d be leased out to others.<br />
These results highlight t h e n e e d for t h e design<br />
and d e m o n s t r a t i o n of a range of technological<br />
options rather t h a n a package of practices if we<br />
are to cater effectively to t h e great variability<br />
w h i c h exists a m o n g farmers, even w i t h i n relatively<br />
h o m o g e n e o u s regions, in their resource e n d o w <br />
m e n t ratios and access to factor markets. These<br />
issues are addressed in m o r e detail by Ryan and<br />
Rathore (1978) and<br />
(1975).<br />
Markets, Infrastructure,<br />
and Policy<br />
Ryan and S u b r a h m a n y a m<br />
It s e e m s clear f r o m t h r e e of t h e f o u r papers in this<br />
session, and f r o m t h e w o r k of Harriss (1981) that<br />
marketing a r r a n g e m e n t s for coarse grains in t h e<br />
SAT countries, especially t h o s e in W e s t Africa,<br />
adversely affect production and also probably<br />
technological change. Arakeri (1982) points out<br />
that sorghum/fertilizer price ratios in India are<br />
inferior to t h o s e of rice and w h e a t . Support pricing<br />
policies for coarse grains are virtually ineffective in<br />
India; w h e n this is c o m b i n e d w i t h their generally<br />
l o w e r price elasticity of d e m a n d c o m p a r e d to rice<br />
and w h e a t (Radhakrishna and M u r t y 1980, p. 51)<br />
t h e pricing policy leads to substantial depressions<br />
in price in periods of abundant supplies.<br />
Peterson (1979)<br />
has calculated t h e average<br />
" r e a l " p r i c e s o f f a r m c o m m o d i t i e s i n w h e a t<br />
equivalents, e x p r e s s e d in t e r m s of t h e kilograms<br />
of fertilizer (at local d o m e s t i c prices) that c o u l d be<br />
purchased w i t h t h e m . Real f a r m prices are m o r e<br />
favorable to farmers in the d e v e l o p e d countries<br />
T a b l e 6 . P r o f i t s a n d c o s t s o f a l t e r n a t i v e s o r g h u m<br />
a c t i v i t i e s in a linear p r o g r a m m i n g e x e r <br />
cise.<br />
Profits C o s t s<br />
A c t i v i t i e s — R s / h a —<br />
Local s o r g h u m variety w i t h 5 0 0 1 0 0<br />
local i n p u t s<br />
Local s o r g h u m variety w i t h 9 7 3 5 3 5<br />
1 0 0 kg N / h a<br />
C S H - 1 s o r g h u m h y b r i d w i t h 1607 2 0 0<br />
local i n p u t s<br />
CSH-1 s o r g h u m hybrid w i t h 3 3 0 0 8 5 3<br />
1 5 0 kg N / h a<br />
L e a s i n g - o u t land 2 0 0 —<br />
S o u r c e : A l l I n d i a C o o r d i n a t e d R e s e a r c h P r o j e c t f o r D r y l a n d<br />
A g r i c u l t u r e ( u n p u b l i s h e d d a t a ) .<br />
5<br />
C S H - 1 h y b r i d w i t h<br />
4<br />
1 5 0 k g / h a of N<br />
3<br />
C S H - 1 h y b r i d<br />
w i t h t r a d i t i o n a l<br />
2<br />
i n p u t s<br />
1<br />
0<br />
2 0 0 5 0 0 1 0 0 0 2 0 0 0 3 0 0 0 4 0 0 0 5 0 0 0<br />
W o r k i n g c a p i t a l a v a i l a b l e ( R s / - )<br />
Figure 2. Optimum choice of activities for m a x -<br />
imizing profits on a farm of 5 ha.<br />
than to their counterparts in t h e developing<br />
countries. For t h e 12 developing SAT countries in<br />
Peterson's analysis, t h e average real price w a s<br />
19, w h i l e for 22 d e v e l o p e d countries t h e price<br />
w a s 35. H e n c e o n average t h e production and<br />
sale of 100 kg of w h e a t grain equivalents in t h e 12<br />
SAT countries w o u l d buy about half t h e fertilizer<br />
that it w o u l d buy if p r o d u c e d and sold in dev<br />
e l o p e d countries. Real prices in Niger are only 7,<br />
in Upper Volta 14, in Senegal 19, and in t h e<br />
C a m e r o o n s 16.<br />
Peterson's analysis suggests t h e s e distortions<br />
f r o m w o r l d price levels involve social costs, in 11<br />
of t h e 12 SAT countries w h i c h he considered, of a<br />
total of U.S. $ 1970 million annually. Niger's social<br />
7 0 6