Report (pdf) - School Management Services
Report (pdf) - School Management Services
Report (pdf) - School Management Services

Create successful ePaper yourself
Turn your PDF publications into a flip-book with our unique Google optimized e-Paper software.
the nine year span of time from 1996-97 to 2006-07, the <strong>School</strong> District of<br />
Bruce pupil/teacher ratio was not further reduced and, hence, further<br />
lowered the organization’s staffing cost/ineffectiveness.<br />
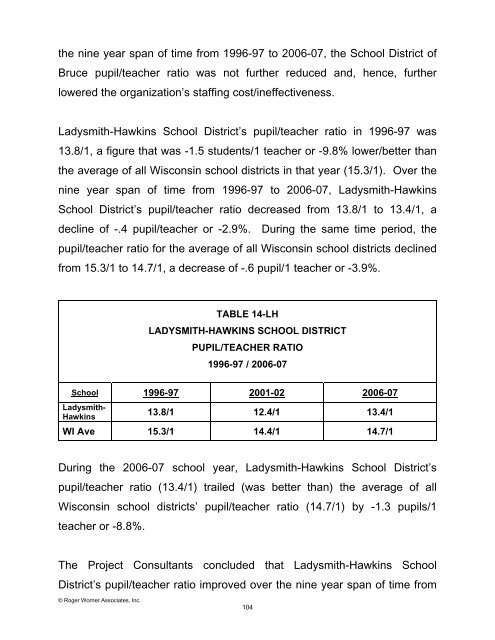
Ladysmith-Hawkins <strong>School</strong> District’s pupil/teacher ratio in 1996-97 was<br />
13.8/1, a figure that was -1.5 students/1 teacher or -9.8% lower/better than<br />
the average of all Wisconsin school districts in that year (15.3/1). Over the<br />
nine year span of time from 1996-97 to 2006-07, Ladysmith-Hawkins<br />
<strong>School</strong> District’s pupil/teacher ratio decreased from 13.8/1 to 13.4/1, a<br />
decline of -.4 pupil/teacher or -2.9%. During the same time period, the<br />
pupil/teacher ratio for the average of all Wisconsin school districts declined<br />
from 15.3/1 to 14.7/1, a decrease of -.6 pupil/1 teacher or -3.9%.<br />
TABLE 14-LH<br />
LADYSMITH-HAWKINS SCHOOL DISTRICT<br />
PUPIL/TEACHER RATIO<br />
1996-97 / 2006-07<br />
<strong>School</strong> 1996-97 2001-02 2006-07<br />
Ladysmith-<br />
Hawkins<br />
13.8/1 12.4/1 13.4/1<br />
WI Ave 15.3/1 14.4/1 14.7/1<br />
During the 2006-07 school year, Ladysmith-Hawkins <strong>School</strong> District’s<br />
pupil/teacher ratio (13.4/1) trailed (was better than) the average of all<br />
Wisconsin school districts’ pupil/teacher ratio (14.7/1) by -1.3 pupils/1<br />
teacher or -8.8%.<br />
The Project Consultants concluded that Ladysmith-Hawkins <strong>School</strong><br />
District’s pupil/teacher ratio improved over the nine year span of time from<br />
© Roger Worner Associates, Inc.<br />
104