Report (pdf) - School Management Services
Report (pdf) - School Management Services
Report (pdf) - School Management Services

Create successful ePaper yourself
Turn your PDF publications into a flip-book with our unique Google optimized e-Paper software.
District, and Weyerhaeuser Area <strong>School</strong> District, respectively, in Tables 4-<br />
B, 4-LH, and 4-W.<br />
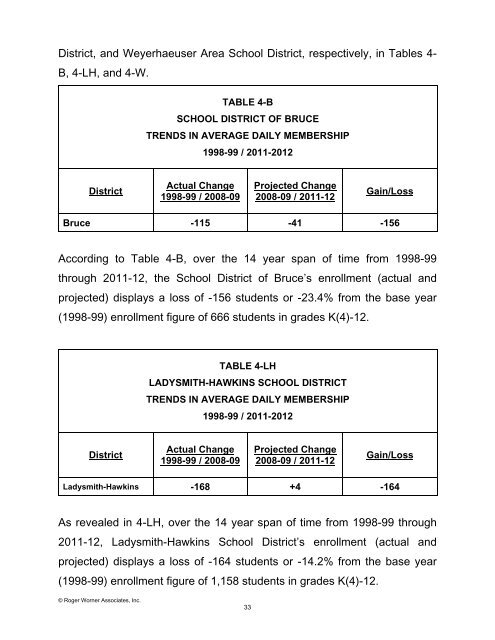
TABLE 4-B<br />
SCHOOL DISTRICT OF BRUCE<br />
TRENDS IN AVERAGE DAILY MEMBERSHIP<br />
1998-99 / 2011-2012<br />
District<br />
Actual Change<br />
1998-99 / 2008-09<br />
Projected Change<br />
2008-09 / 2011-12<br />
Gain/Loss<br />
Bruce -115 -41 -156<br />
According to Table 4-B, over the 14 year span of time from 1998-99<br />
through 2011-12, the <strong>School</strong> District of Bruce’s enrollment (actual and<br />
projected) displays a loss of -156 students or -23.4% from the base year<br />
(1998-99) enrollment figure of 666 students in grades K(4)-12.<br />
TABLE 4-LH<br />
LADYSMITH-HAWKINS SCHOOL DISTRICT<br />
TRENDS IN AVERAGE DAILY MEMBERSHIP<br />
1998-99 / 2011-2012<br />
District<br />
Actual Change<br />
1998-99 / 2008-09<br />
Projected Change<br />
2008-09 / 2011-12<br />
Gain/Loss<br />
Ladysmith-Hawkins -168 +4 -164<br />
As revealed in 4-LH, over the 14 year span of time from 1998-99 through<br />
2011-12, Ladysmith-Hawkins <strong>School</strong> District’s enrollment (actual and<br />
projected) displays a loss of -164 students or -14.2% from the base year<br />
(1998-99) enrollment figure of 1,158 students in grades K(4)-12.<br />
© Roger Worner Associates, Inc.<br />
33