Development Plan - City of Playford - SA.Gov.au
Development Plan - City of Playford - SA.Gov.au
Development Plan - City of Playford - SA.Gov.au

You also want an ePaper? Increase the reach of your titles
YUMPU automatically turns print PDFs into web optimized ePapers that Google loves.
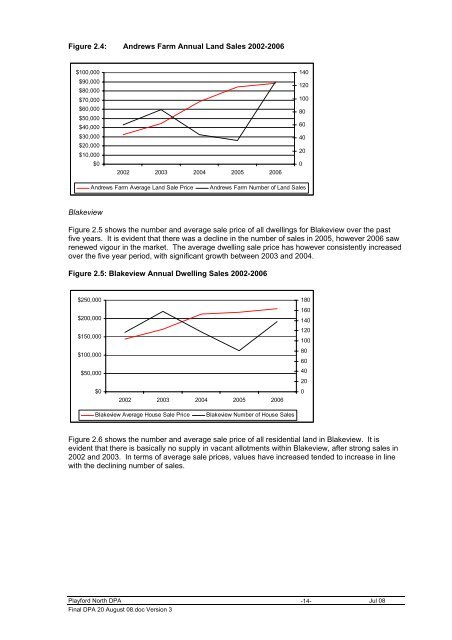
Figure 2.4: Andrews Farm Annual Land Sales 2002-2006<br />
$100,000<br />
$90,000<br />
$80,000<br />
$70,000<br />
$60,000<br />
$50,000<br />
$40,000<br />
$30,000<br />
$20,000<br />
$10,000<br />
$0<br />
2002 2003 2004 2005 2006<br />
140<br />
120<br />
100<br />
80<br />
60<br />
40<br />
20<br />
0<br />
Andrews Farm Average Land Sale Price<br />
Andrews Farm Number <strong>of</strong> Land Sales<br />
Blakeview<br />
Figure 2.5 shows the number and average sale price <strong>of</strong> all dwellings for Blakeview over the past<br />
five years. It is evident that there was a decline in the number <strong>of</strong> sales in 2005, however 2006 saw<br />
renewed vigour in the market. The average dwelling sale price has however consistently increased<br />
over the five year period, with significant growth between 2003 and 2004.<br />
Figure 2.5: Blakeview Annual Dwelling Sales 2002-2006<br />
$250,000<br />
$200,000<br />
$150,000<br />
$100,000<br />
$50,000<br />
$0<br />
2002 2003 2004 2005 2006<br />
180<br />
160<br />
140<br />
120<br />
100<br />
80<br />
60<br />
40<br />
20<br />
0<br />
Blakeview Average House Sale Price<br />
Blakeview Number <strong>of</strong> House Sales<br />
Figure 2.6 shows the number and average sale price <strong>of</strong> all residential land in Blakeview. It is<br />
evident that there is basically no supply in vacant allotments within Blakeview, after strong sales in<br />
2002 and 2003. In terms <strong>of</strong> average sale prices, values have increased tended to increase in line<br />
with the declining number <strong>of</strong> sales.<br />
<strong>Playford</strong> North DPA -14-<br />
Jul 08<br />
Final DPA 20 August 08.doc Version 3