Development Plan - City of Playford - SA.Gov.au
Development Plan - City of Playford - SA.Gov.au
Development Plan - City of Playford - SA.Gov.au

Create successful ePaper yourself
Turn your PDF publications into a flip-book with our unique Google optimized e-Paper software.
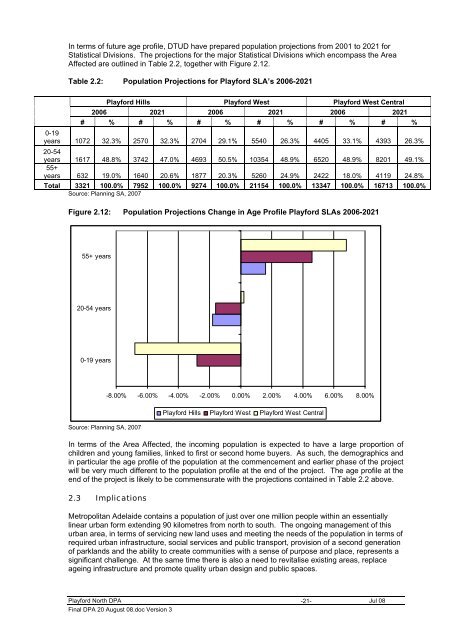
In terms <strong>of</strong> future age pr<strong>of</strong>ile, DTUD have prepared population projections from 2001 to 2021 for<br />
Statistical Divisions. The projections for the major Statistical Divisions which encompass the Area<br />
Affected are outlined in Table 2.2, together with Figure 2.12.<br />
Table 2.2: Population Projections for <strong>Playford</strong> SLA’s 2006-2021<br />
<strong>Playford</strong> Hills <strong>Playford</strong> West <strong>Playford</strong> West Central<br />
2006 2021 2006 2021 2006 2021<br />
# % # % # % # % # % # %<br />
0-19<br />
years 1072 32.3% 2570 32.3% 2704 29.1% 5540 26.3% 4405 33.1% 4393 26.3%<br />
20-54<br />
years 1617 48.8% 3742 47.0% 4693 50.5% 10354 48.9% 6520 48.9% 8201 49.1%<br />
55+<br />
years 632 19.0% 1640 20.6% 1877 20.3% 5260 24.9% 2422 18.0% 4119 24.8%<br />
Total 3321 100.0% 7952 100.0% 9274 100.0% 21154 100.0% 13347 100.0% 16713 100.0%<br />
Source: <strong>Plan</strong>ning <strong>SA</strong>, 2007<br />
Figure 2.12: Population Projections Change in Age Pr<strong>of</strong>ile <strong>Playford</strong> SLAs 2006-2021<br />
55+ years<br />
20-54 years<br />
0-19 years<br />
-8.00% -6.00% -4.00% -2.00% 0.00% 2.00% 4.00% 6.00% 8.00%<br />
Source: <strong>Plan</strong>ning <strong>SA</strong>, 2007<br />
<strong>Playford</strong> Hills <strong>Playford</strong> West <strong>Playford</strong> West Central<br />
In terms <strong>of</strong> the Area Affected, the incoming population is expected to have a large proportion <strong>of</strong><br />
children and young families, linked to first or second home buyers. As such, the demographics and<br />
in particular the age pr<strong>of</strong>ile <strong>of</strong> the population at the commencement and earlier phase <strong>of</strong> the project<br />
will be very much different to the population pr<strong>of</strong>ile at the end <strong>of</strong> the project. The age pr<strong>of</strong>ile at the<br />
end <strong>of</strong> the project is likely to be commensurate with the projections contained in Table 2.2 above.<br />
2.3 Implications<br />
Metropolitan Adelaide contains a population <strong>of</strong> just over one million people within an essentially<br />
linear urban form extending 90 kilometres from north to south. The ongoing management <strong>of</strong> this<br />
urban area, in terms <strong>of</strong> servicing new land uses and meeting the needs <strong>of</strong> the population in terms <strong>of</strong><br />
required urban infrastructure, social services and public transport, provision <strong>of</strong> a second generation<br />
<strong>of</strong> parklands and the ability to create communities with a sense <strong>of</strong> purpose and place, represents a<br />
significant challenge. At the same time there is also a need to revitalise existing areas, replace<br />
ageing infrastructure and promote quality urban design and public spaces.<br />
<strong>Playford</strong> North DPA -21-<br />
Jul 08<br />
Final DPA 20 August 08.doc Version 3