- Page 2:
the oxford handbook of ............
- Page 6:
the oxford handbooks of political s
- Page 10:
Dedicated to my parents, Barbara an
- Page 16:
viii contents 9. Coalition Governme
- Page 20:
x contents PART IX DEMOCRACY AND CA
- Page 24:
xii contents 56. The Future of Anal
- Page 28:
xiv about the contributors CharlesM
- Page 32:
xvi about the contributors Thomas R
- Page 38:
part i ............................
- Page 44:
4 introduction: the reach of politi
- Page 48:
6 introduction: the reach of politi
- Page 52:
8 introduction: the reach of politi
- Page 56:
10 introduction: the reach of polit
- Page 60:
12 introduction: the reach of polit
- Page 64:
14 introduction: the reach of polit
- Page 68:
16 introduction: the reach of polit
- Page 72:
18 introduction: the reach of polit
- Page 76:
20 introduction: the reach of polit
- Page 80:
22 introduction: the reach of polit
- Page 84:
24 introduction: the reach of polit
- Page 90:
part ii ...........................
- Page 96:
30 voters, candidates, and parties
- Page 100:
32 voters, candidates, and parties
- Page 104:
34 voters, candidates, and parties
- Page 108:
36 voters, candidates, and parties
- Page 112:
38 voters, candidates, and parties
- Page 116:
40 voters, candidates, and parties
- Page 120:
42 voters, candidates, and parties
- Page 124:
44 voters, candidates, and parties
- Page 128:
46 voters, candidates, and parties
- Page 132:
48 voters, candidates, and parties
- Page 136:
chapter 3 .........................
- Page 140:
52 rational voters and political ad
- Page 144:
54 rational voters and political ad
- Page 148:
56 rational voters and political ad
- Page 152:
58 rational voters and political ad
- Page 156:
60 rational voters and political ad
- Page 160:
62 rational voters and political ad
- Page 164:
chapter 4 .........................
- Page 168:
66 candidate objectives and elector
- Page 172:
68candidate objectives and electora
- Page 176:
70 candidate objectives and elector
- Page 180:
72 candidate objectives and elector
- Page 184:
74 candidate objectives and elector
- Page 188:
76 candidate objectives and elector
- Page 192:
78candidate objectives and electora
- Page 196:
80 candidate objectives and elector
- Page 200:
82 candidate objectives and elector
- Page 204:
chapter 5 .........................
- Page 208:
86 political income redistribution
- Page 212:
88 political income redistribution
- Page 216:
90 political income redistribution
- Page 220:
92 political income redistribution
- Page 224:
94 political income redistribution
- Page 228:
96 political income redistribution
- Page 232:
98 political income redistribution
- Page 236:
100 political income redistribution
- Page 240:
chapter 6 .........................
- Page 244:
104 the impact of electoral laws th
- Page 248:
106 the impact of electoral laws No
- Page 252:
108 the impact of electoral laws Th
- Page 256:
110 the impact of electoral laws ba
- Page 260:
112 the impact of electoral laws a
- Page 264:
114 the impact of electoral laws Ce
- Page 268:
116 the impact of electoral laws Re
- Page 272:
118 the impact of electoral laws Ta
- Page 278:
chapter 7 .........................
- Page 282:
michael laver 123 motion of confide
- Page 286:
michael laver 125 to turn individua
- Page 290:
michael laver 127 terms legislative
- Page 294:
michael laver 129 If parliamentaria
- Page 298:
michael laver 131 fund the costs of
- Page 302:
michael laver 133 than smaller cart
- Page 306:
michael laver 135 dominated by the
- Page 310:
michael laver 137 policy positions
- Page 314:
michael laver 139 and Stevenson, R.
- Page 318:
chapter 8 .........................
- Page 322:
gary w. cox 143 3 The Legislative S
- Page 326:
gary w. cox 145 coalitions at diffe
- Page 330:
gary w. cox 147 powers wielded by o
- Page 334:
gary w. cox 149 the literature does
- Page 338:
gary w. cox 151 In general, assembl
- Page 342:
7.3 Roll Rates gary w. cox 153 The
- Page 346:
gary w. cox 155 One argument in whi
- Page 350:
gary w. cox 157 (1) complex/conflic
- Page 354:
gary w. cox 159 Baron, D.1998. Comp
- Page 358:
gary w. cox 161 and S. Smith, S.199
- Page 362:
daniel diermeier 163 It is the dist
- Page 366:
daniel diermeier 165 super-majority
- Page 370:
daniel diermeier 167 AC BC C Dimens
- Page 374:
daniel diermeier 169 accepted, the
- Page 378:
daniel diermeier 171 The demand bar
- Page 382:
daniel diermeier 173 6 Non-cooperat
- Page 386:
daniel diermeier 175 section, this
- Page 390:
daniel diermeier 177 References Ans
- Page 394:
daniel diermeier 179 1998. Efficien
- Page 398:
michael cutrone & nolan mC carty 18
- Page 402:
michael cutrone & nolan mC carty 18
- Page 406:
michael cutrone & nolan mC carty 18
- Page 410:
michael cutrone & nolan mC carty 18
- Page 414:
michael cutrone & nolan mC carty 18
- Page 418:
michael cutrone & nolan mC carty 19
- Page 422:
michael cutrone & nolan mC carty 19
- Page 426:
michael cutrone & nolan mC carty 19
- Page 434:
chapter 11 ........................
- Page 438:
ui j. p. de figueiredo, tonja jacob
- Page 442:
ui j. p. de figueiredo, tonja jacob
- Page 446:
ui j. p. de figueiredo, tonja jacob
- Page 450:
ui j. p. de figueiredo, tonja jacob
- Page 454:
ui j. p. de figueiredo, tonja jacob
- Page 458:
ui j. p. de figueiredo, tonja jacob
- Page 462:
ui j. p. de figueiredo, tonja jacob
- Page 466:
ui j. p. de figueiredo, tonja jacob
- Page 470:
ui j. p. de figueiredo, tonja jacob
- Page 474:
ui j. p. de figueiredo, tonja jacob
- Page 478:
ui j. p. de figueiredo, tonja jacob
- Page 482:
chapter 12 ........................
- Page 486:
keith krehbiel 225 Conventional wis
- Page 490:
keith krehbiel 227 Outcomes p I II
- Page 494:
keith krehbiel 229 Outcome I II III
- Page 498:
keith krehbiel 231 No rolls Minorit
- Page 502:
keith krehbiel 233 5 Endogenous Sta
- Page 506:
keith krehbiel 235 Table 12.2 Sum o
- Page 510:
keith krehbiel 237 Sum of squared r
- Page 514:
keith krehbiel 239 paucity of major
- Page 518:
chapter 13 ........................
- Page 522:
charles m. cameron 243 causal mecha
- Page 526:
charles m. cameron 245 (3) the pres
- Page 530:
charles m. cameron 247 way: the bla
- Page 534:
charles m. cameron 249 president wh
- Page 538:
charles m. cameron 251 leaving the
- Page 542:
charles m. cameron 253 This topic i
- Page 546:
charles m. cameron 255 Lewis, D.200
- Page 550:
john d. huber & charles r. shipan 2
- Page 554:
john d. huber & charles r. shipan 2
- Page 558:
john d. huber & charles r. shipan 2
- Page 562:
john d. huber & charles r. shipan 2
- Page 566:
john d. huber & charles r. shipan 2
- Page 570:
john d. huber & charles r. shipan 2
- Page 574:
john d. huber & charles r. shipan 2
- Page 578:
john d. huber & charles r. shipan 2
- Page 582:
chapter 15 ........................
- Page 586:
mathew d. m C cubbins & daniel b. r
- Page 590:
mathew d. m C cubbins & daniel b. r
- Page 594:
mathew d. m C cubbins & daniel b. r
- Page 598:
mathew d. m C cubbins & daniel b. r
- Page 602:
mathew d. m C cubbins & daniel b. r
- Page 606:
mathew d. m C cubbins & daniel b. r
- Page 610:
part v ............................
- Page 616:
290 constitutionalism In general, i
- Page 620:
292 constitutionalism can make a la
- Page 624:
294 constitutionalism “reasonable
- Page 628:
296 constitutionalism the Electoral
- Page 632:
298 constitutionalism But you may n
- Page 636:
300 constitutionalism certain commo
- Page 640:
302 constitutionalism behavior. In
- Page 644:
304 constitutionalism government, T
- Page 648:
306 constitutionalism Hume (1739-40
- Page 652:
308 constitutionalism coordination
- Page 656:
310 constitutionalism Hobbes,T.1642
- Page 660:
chapter 17 ........................
- Page 664:
314 self-enforcingdemocracy individ
- Page 668:
316 self-enforcingdemocracy First t
- Page 672:
318 self-enforcingdemocracy 5 4 3 2
- Page 676:
320 self-enforcingdemocracy democra
- Page 680:
322 self-enforcingdemocracy Thus, l
- Page 684:
324 self-enforcingdemocracy point i
- Page 688:
326 self-enforcingdemocracy whether
- Page 692:
328 self-enforcingdemocracy Marx,K.
- Page 696:
330 constitutions as expressive doc
- Page 700:
332 constitutions as expressive doc
- Page 704:
334 constitutions as expressive doc
- Page 708:
336 constitutions as expressive doc
- Page 712:
338 constitutions as expressive doc
- Page 716:
340 constitutions as expressive doc
- Page 720:
chapter 19 ........................
- Page 724:
344 the protection of liberty, prop
- Page 728:
346 the protection of liberty, prop
- Page 732:
348 the protection of liberty, prop
- Page 736:
350 the protection of liberty, prop
- Page 740:
352 the protection of liberty, prop
- Page 744:
354 the protection of liberty, prop
- Page 748:
356 the protection of liberty, prop
- Page 752:
358 federalism factors. Moreover, t
- Page 756:
360 federalism classics of politica
- Page 760:
362 federalism federations, provinc
- Page 764:
364 federalism work on federalism
- Page 768:
366 federalism skewed income distri
- Page 772:
368 federalism literature often com
- Page 776:
370 federalism Musgrave, R.1959. Th
- Page 782:
chapter 21 ........................
- Page 786:
hervé moulin 375 the set R contai
- Page 790:
hervé moulin 377 Endstate justice:
- Page 794:
hervé moulin 379 4 The Complementa
- Page 798:
hervé moulin 381 whether direct or
- Page 802:
hervé moulin 383 The advantages of
- Page 806:
hervé moulin 385 will submit a bid
- Page 810:
hervé moulin 387 References Ausube
- Page 814:
hervé moulin 389 Pattanaik,P.K.,an
- Page 818:
donald g. saari 391 C 9 + 2s C 3 4
- Page 822:
donald g. saari 393 winner Ann wins
- Page 826:
donald g. saari 395 desired A ∼ C
- Page 830:
donald g. saari 397 C Procedure lin
- Page 834:
donald g. saari 399 where the plura
- Page 838:
donald g. saari 401 In selecting th
- Page 842:
donald g. saari 403 Next, add “co
- Page 846:
donald g. saari 405 7 Arrow and Sen
- Page 850:
donald g. saari 407 References Arro
- Page 854:
charles blackorby & walter bossert
- Page 858:
charles blackorby & walter bossert
- Page 862:
charles blackorby & walter bossert
- Page 866:
charles blackorby & walter bossert
- Page 870:
charles blackorby & walter bossert
- Page 874:
charles blackorby & walter bossert
- Page 878:
charles blackorby & walter bossert
- Page 882:
charles blackorby & walter bossert
- Page 886:
chapter 24 ........................
- Page 890:
steven j. brams 427 50 per cent van
- Page 894:
steven j. brams 429 3. Assume playe
- Page 898:
steven j. brams 431 Solving for x g
- Page 902:
steven j. brams 433 adifferent set
- Page 906:
steven j. brams 435 Next consider a
- Page 910:
steven j. brams 437 Shishido, H.,an
- Page 918:
chapter 25 ........................
- Page 922:
stanley l. winer & walter hettich 4
- Page 926:
stanley l. winer & walter hettich 4
- Page 930:
stanley l. winer & walter hettich 4
- Page 934:
stanley l. winer & walter hettich 4
- Page 938:
stanley l. winer & walter hettich 4
- Page 942:
stanley l. winer & walter hettich 4
- Page 946:
stanley l. winer & walter hettich 4
- Page 950:
stanley l. winer & walter hettich 4
- Page 954:
stanley l. winer & walter hettich 4
- Page 958:
stanley l. winer & walter hettich 4
- Page 962:
stanley l. winer & walter hettich 4
- Page 966:
jürgen von hagen 465 are, the grea
- Page 970:
jürgen von hagen 467 induce a shif
- Page 974:
jürgen von hagen 469 targeted poli
- Page 978:
jürgen von hagen 471 final budget
- Page 982:
jürgen von hagen 473 an elevated p
- Page 986:
jürgen von hagen 475 References Ad
- Page 990:
jürgen von hagen 477 Persson,T.,Ro
- Page 994:
chapter 27 ........................
- Page 998:
john ledyard 481 Does this mean one
- Page 1002:
john ledyard 483 produced. Taxes ar
- Page 1006:
john ledyard 485 markets to attain
- Page 1010:
john ledyard 487 Example 15: Suppos
- Page 1014:
john ledyard 489 So we have two int
- Page 1018:
john ledyard 491 for mechanisms tha
- Page 1022:
john ledyard 493 particular mechani
- Page 1026:
john ledyard 495 Myerson (1981) cal
- Page 1030:
3.4 “Voting Works” in Large Env
- Page 1034:
john ledyard 499 maximize their pro
- Page 1038:
john ledyard 501 and Satterthwaite,
- Page 1042:
david e. wildasin 503 warrant furth
- Page 1046:
david e. wildasin 505 mobility impl
- Page 1050:
david e. wildasin 507 A r' = r* + t
- Page 1054:
david e. wildasin 509 equivalent in
- Page 1058:
david e. wildasin 511 (on property)
- Page 1062:
david e. wildasin 513 First, the pa
- Page 1066:
david e. wildasin 515 be assessed,
- Page 1070:
david e. wildasin 517 can materiali
- Page 1074:
david e. wildasin 519 political par
- Page 1078:
part viii .........................
- Page 1084:
524 the non-politics of monetary po
- Page 1088:
526 the non-politics of monetary po
- Page 1092:
528 the non-politics of monetary po
- Page 1096:
530 the non-politics of monetary po
- Page 1100:
532 the non-politics of monetary po
- Page 1104:
534 the non-politics of monetary po
- Page 1108:
536 the non-politics of monetary po
- Page 1112:
538 the non-politics of monetary po
- Page 1116:
540 the non-politics of monetary po
- Page 1120:
542 the non-politics of monetary po
- Page 1124:
544 the non-politics of monetary po
- Page 1128:
546 political-economic cycles diffe
- Page 1132:
548 political-economic cycles this
- Page 1136:
550 political-economic cycles As th
- Page 1140:
552 political-economic cycles incen
- Page 1144:
554 political-economic cycles unemp
- Page 1148:
556 political-economic cycles prefe
- Page 1152:
558 political-economic cycles polic
- Page 1156:
560 political-economic cycles oppos
- Page 1160:
562 political-economic cycles Downs
- Page 1164:
564 political-economic cycles 2000.
- Page 1168:
566 voting and the macroeconomy the
- Page 1172:
568 voting and the macroeconomy Fai
- Page 1176:
570 voting and the macroeconomy dat
- Page 1180:
572 voting and the macroeconomy 4.2
- Page 1184:
574 voting and the macroeconomy Sub
- Page 1188:
576 voting and the macroeconomy lat
- Page 1192:
578 voting and the macroeconomy and
- Page 1196:
580 voting and the macroeconomy vot
- Page 1200:
582 voting and the macroeconomy The
- Page 1204:
584 voting and the macroeconomy fro
- Page 1208:
586 voting and the macroeconomy Rod
- Page 1212:
588 the politics of exchange rates
- Page 1216:
590 the politics of exchange rates
- Page 1220:
592 the politics of exchange rates
- Page 1224:
594 the politics of exchange rates
- Page 1228:
596 the politics of exchange rates
- Page 1234:
part ix ...........................
- Page 1240:
602 capitalism and democracy should
- Page 1244:
604 capitalism and democracy democr
- Page 1248:
606 capitalism and democracy attent
- Page 1252:
608 capitalism and democracy Rather
- Page 1256:
610 capitalism and democracy concen
- Page 1260:
612 capitalism and democracy Other
- Page 1264:
614 capitalism and democracy system
- Page 1268:
616 capitalism and democracy risk a
- Page 1272:
618 capitalism and democracy model,
- Page 1276:
620 capitalism and democracy Esping
- Page 1280:
622 capitalism and democracy Osborn
- Page 1284:
chapter 34 ........................
- Page 1288:
626 inequality 60 50 40 30 20 6 7 8
- Page 1292:
628 inequality 60 50 40 30 20 0 .2
- Page 1296:
630 inequality and fractionalizatio
- Page 1300:
632 inequality in a common legal sy
- Page 1304:
634 inequality wealth. Most similar
- Page 1308:
636 inequality Europe can explain t
- Page 1312:
638 inequality from left-wing polic
- Page 1316:
640 inequality Checchi, D.,Ichino,
- Page 1320:
chapter 35 ........................
- Page 1324:
644 the role of the state in the ec
- Page 1328:
646 the role of the state in the ec
- Page 1332:
648 the role of the state in the ec
- Page 1336:
650 the role of the state in the ec
- Page 1340:
652 the role of the state in the ec
- Page 1344:
654 the role of the state in the ec
- Page 1348:
chapter 36 ........................
- Page 1352:
658 democratization all regimes acq
- Page 1356:
660 democratization that often driv
- Page 1360:
662 democratization over the party
- Page 1364:
664 democratization A focus on the
- Page 1368:
666 democratization 1996. Illusions
- Page 1372:
668 democratization McFaul,M.,Petro
- Page 1378:
part x ............................
- Page 1384:
674 paths ofeconomic and political
- Page 1388:
676 paths ofeconomic and political
- Page 1392:
678 paths ofeconomic and political
- Page 1396:
680 paths ofeconomic and political
- Page 1400:
682 paths ofeconomic and political
- Page 1404:
684 paths ofeconomic and political
- Page 1408:
686 paths ofeconomic and political
- Page 1412:
688 paths ofeconomic and political
- Page 1416:
690 paths ofeconomic and political
- Page 1420:
692 paths ofeconomic and political
- Page 1424:
694 authoritarian government study
- Page 1428:
696 authoritarian government us, ho
- Page 1432:
698 authoritarian government proper
- Page 1436:
700 authoritarian government Gomber
- Page 1440:
702 authoritarian government Somoza
- Page 1444:
704 authoritarian government The la
- Page 1448:
706 authoritarian government Barro,
- Page 1452:
chapter 39 ........................
- Page 1456:
710 the role of the state in develo
- Page 1460:
712 the role of the state in develo
- Page 1464:
714 the role of the state in develo
- Page 1468:
716 the role of the state in develo
- Page 1472:
718 the role of the state in develo
- Page 1476:
720 the role of the state in develo
- Page 1480:
722 the role of the state in develo
- Page 1484:
724 electoral systems and economic
- Page 1488:
726 electoral systems and economic
- Page 1492:
728 electoral systems and economic
- Page 1496:
730 electoral systems and economic
- Page 1500:
732 electoral systems and economic
- Page 1504:
734 electoral systems and economic
- Page 1508:
736 electoral systems and economic
- Page 1512:
738 electoral systems and economic
- Page 1516:
740 economic geography Physical geo
- Page 1520:
742 economic geography dramatically
- Page 1524:
744 economic geography 3.2 Linkages
- Page 1528:
746 economic geography Real wages,
- Page 1532:
748 economic geography outcome—th
- Page 1536:
750 economic geography people’s t
- Page 1540:
752 economic geography neighbours
- Page 1544:
754 economic geography Sachs, J.D.2
- Page 1550:
chapter 42 ........................
- Page 1554:
david a. lake 759 E. E. Schattschne
- Page 1558:
david a. lake 761 to contemporary d
- Page 1562:
david a. lake 763 by incorporating
- Page 1566:
david a. lake 765 political systems
- Page 1570:
david a. lake 767 a possible second
- Page 1574:
david a. lake 769 from internationa
- Page 1578:
david a. lake 771 party cannot make
- Page 1582:
david a. lake 773 Ashenfelter,O.A.,
- Page 1586:
david a. lake 775 Krasner, S.D.1976
- Page 1590:
david a. lake 777 Sunkel, O.1969. N
- Page 1594:
enrico spolaore 779 is more strongl
- Page 1598:
enrico spolaore 781 developed in th
- Page 1602:
enrico spolaore 783 4 Borders,Votin
- Page 1606:
enrico spolaore 785 the total costs
- Page 1610:
enrico spolaore 787 By contrast, th
- Page 1614:
enrico spolaore 789 explore the cas
- Page 1618:
enrico spolaore 791 income) in regi
- Page 1622:
enrico spolaore 793 8 Borders and B
- Page 1626:
enrico spolaore 795 countries may b
- Page 1630:
enrico spolaore 797 Bordignon, M.,a
- Page 1634:
chapter 44 ........................
- Page 1638:
arry eichengreen 801 acquired the s
- Page 1642:
arry eichengreen 803 how the EPU, b
- Page 1646:
arry eichengreen 805 Ministers, an
- Page 1650:
arry eichengreen 807 policy decisio
- Page 1654:
arry eichengreen 809 process in eco
- Page 1658:
arry eichengreen 811 To be sure, am
- Page 1662:
arry eichengreen 813 Gabel, M.2001.
- Page 1666:
onald rogowski 815 (e.g. workers wi
- Page 1670:
onald rogowski 817 Under the genera
- Page 1674:
onald rogowski 819 prediction of th
- Page 1678:
onald rogowski 821 real wage where
- Page 1682:
onald rogowski 823 repeatedly crush
- Page 1686:
onald rogowski 825 labor-market mec
- Page 1690:
onald rogowski 827 Milner, to under
- Page 1694:
part xii ..........................
- Page 1700:
832 international conflict of confl
- Page 1704:
834 international conflict themselv
- Page 1708:
836 international conflict claim in
- Page 1712:
838 international conflict states:
- Page 1716:
840 international conflict national
- Page 1720:
842 international conflict 3.3 Inst
- Page 1724:
844 international conflict and defe
- Page 1728:
846 international conflict new demo
- Page 1732:
848 international conflict goods-or
- Page 1736:
850 international conflict McKelvey
- Page 1740:
chapter 47 ........................
- Page 1744:
854 ethnic mobilization and ethnic
- Page 1748:
856 ethnic mobilization and ethnic
- Page 1752:
858 ethnic mobilization and ethnic
- Page 1756:
860 ethnic mobilization and ethnic
- Page 1760:
862 ethnic mobilization and ethnic
- Page 1764:
864 ethnic mobilization and ethnic
- Page 1768:
866 ethnic mobilization and ethnic
- Page 1772:
868 ethnic mobilization and ethnic
- Page 1776:
870 democracy, peace, and war to re
- Page 1780:
872 democracy, peace, and war The n
- Page 1784:
874 democracy, peace, and war 1.2 A
- Page 1788:
876 democracy, peace, and war not e
- Page 1792:
878 democracy, peace, and war Gelpi
- Page 1796:
880 democracy, peace, and war Snyde
- Page 1800:
882 anarchy of self-interest, for a
- Page 1804:
884 anarchy one in which f (G i )=G
- Page 1808:
886 anarchy technology in (4) the r
- Page 1812:
888 anarchy unforeseen contingencie
- Page 1816:
890 anarchy in the benchmark model.
- Page 1820:
892 anarchy know more about the win
- Page 1824:
894 anarchy “proprietary;” that
- Page 1828:
896 anarchy Skaperdas, S.1992. Coop
- Page 1834:
chapter 50 ........................
- Page 1838:
david austen-smith 901 understandin
- Page 1842:
david austen-smith 903 by studying
- Page 1846: david austen-smith 905 and about th
- Page 1850: david austen-smith 907 policy. But
- Page 1854: david austen-smith 909 that for eve
- Page 1858: david austen-smith 911 Poisson game
- Page 1862: david austen-smith 913 Austen-Smith
- Page 1866: chapter 51 ........................
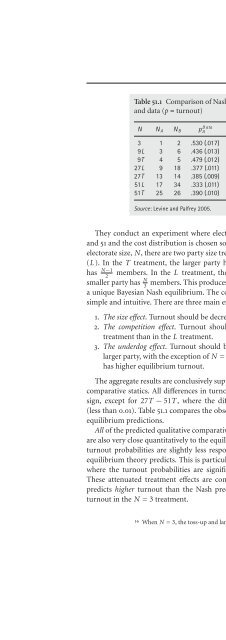
- Page 1870: thomas r. palfrey 917 winners do no
- Page 1874: thomas r. palfrey 919 so this metho
- Page 1878: thomas r. palfrey 921 is that subtl
- Page 1882: thomas r. palfrey 923 3.1 Competiti
- Page 1886: thomas r. palfrey 925 equilibria, t
- Page 1890: thomas r. palfrey 927 4 Information
- Page 1894: thomas r. palfrey 929 gradually agg
- Page 1900: 932 laboratory experiments There ar
- Page 1904: 934 laboratory experiments Palfrey,
- Page 1908: 936 laboratory experiments Morton,
- Page 1912: 938 the tool kit of economic sociol
- Page 1916: 940 the tool kit of economic sociol
- Page 1920: 942 the tool kit of economic sociol
- Page 1924: 944 the tool kit of economic sociol
- Page 1928: 946 the tool kit of economic sociol
- Page 1932: 948 the tool kit of economic sociol
- Page 1936: 950 the tool kit of economic sociol
- Page 1940: 952 the evolutionary basis of colle
- Page 1944: 954 the evolutionary basis of colle
- Page 1948:
956 the evolutionary basis of colle
- Page 1952:
Table 53.1 Seven experimental games
- Page 1956:
960 the evolutionary basis of colle
- Page 1960:
962 the evolutionary basis of colle
- Page 1964:
964 the evolutionary basis of colle
- Page 1968:
966 the evolutionary basis of colle
- Page 1974:
part xiv ..........................
- Page 1980:
972 questions about a paradox becau
- Page 1984:
974 questions about a paradox you s
- Page 1988:
976 questions about a paradox I’m
- Page 1992:
978questionsaboutaparadox influence
- Page 1996:
chapter 55 ........................
- Page 2000:
982 politics and scientific enquiry
- Page 2004:
984 politics and scientific enquiry
- Page 2008:
986 politics and scientific enquiry
- Page 2012:
988 politics and scientific enquiry
- Page 2016:
990 politics and scientific enquiry
- Page 2020:
992 politics and scientific enquiry
- Page 2024:
994 politics and scientific enquiry
- Page 2028:
chapter 56 ........................
- Page 2032:
998 the future of analytical politi
- Page 2036:
1000 the future of analytical polit
- Page 2040:
1002 the future of analytical polit
- Page 2044:
1004 what is missing from political
- Page 2048:
1006 what is missing from political
- Page 2052:
1008 what is missing from political
- Page 2056:
chapter 58 ........................
- Page 2060:
1012 modeling party competition in
- Page 2064:
1014 modeling party competition in
- Page 2068:
1016 modeling party competition in
- Page 2072:
1018 modeling party competition in
- Page 2076:
1020 modeling party competition in
- Page 2080:
1022 modeling party competition in
- Page 2084:
1024 modeling party competition in
- Page 2088:
1026 modeling party competition in
- Page 2092:
1028 modeling party competition in
- Page 2096:
1030 modeling party competition in
- Page 2100:
1032 the riker objection revisited
- Page 2104:
1034 the riker objection revisited
- Page 2108:
1036 the riker objection revisited
- Page 2112:
1038 the riker objection revisited
- Page 2116:
1040 the riker objection revisited
- Page 2120:
1042 the riker objection revisited
- Page 2124:
1044 the riker objection revisited
- Page 2128:
1046 the riker objection revisited
- Page 2132:
1048 the riker objection revisited
- Page 2136:
Name Index ........................
- Page 2140:
1052 name index Caesar 307-8 Cain,
- Page 2144:
1054 name index Eyerman, J 875 Eyta
- Page 2148:
1056 name index Hertzendorf, M N 59
- Page 2152:
1058 name index Lijphart, A 103, 10
- Page 2156:
1060 name index North, D C 20 n24,
- Page 2160:
1062 name index Rowe, D M 771 Rowth
- Page 2164:
1064 name index Talvi, E 466, 473 T
- Page 2168:
Subject Index .....................
- Page 2172:
1068 subject index Bulgaria 314 bur
- Page 2176:
1070 subject index constitutionalis
- Page 2180:
1072 subject index democratization
- Page 2184:
1074 subject index economics, and f
- Page 2188:
1076 subject index European Court o
- Page 2192:
1078 subject index game theory: (co
- Page 2196:
1080 subject index International Co
- Page 2200:
1082 subject index liberalization:
- Page 2204:
1084 subject index partisanship: (c
- Page 2208:
1086 subject index political-econom
- Page 2212:
1088 subject index and policy 43-4
- Page 2216:
1090 subject index state, the: (con
- Page 2220:
1092 subject index United States Su