

ANNUAL REPORT 2014/15
DHET Annual Report 2014-2015
DHET Annual Report 2014-2015

You also want an ePaper? Increase the reach of your titles
YUMPU automatically turns print PDFs into web optimized ePapers that Google loves.
DEPARTMENT OF HIGHER EDUCATION AND TRAINING<br />
Vote 17<br />
<strong>2014</strong>/<strong>15</strong> Annual Report<br />
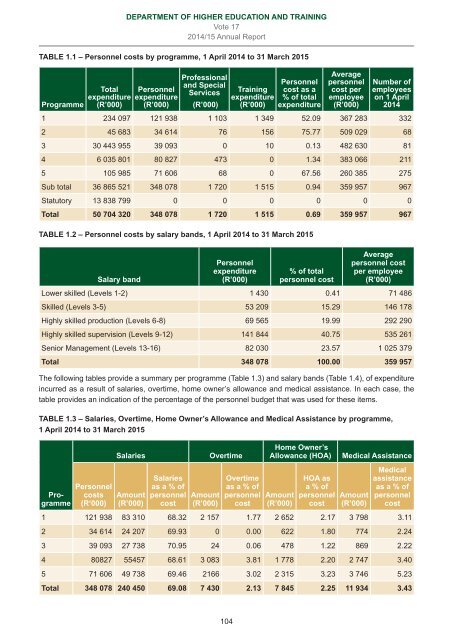
TABLE 1.1 – Personnel costs by programme, 1 April <strong>2014</strong> to 31 March 20<strong>15</strong><br />
Programme<br />
Total<br />
expenditure<br />
(R’000)<br />
Personnel<br />
expenditure<br />
(R’000)<br />
Professional<br />
and Special<br />
Services<br />
(R’000)<br />
Training<br />
expenditure<br />
(R’000)<br />
Personnel<br />
cost as a<br />
% of total<br />
expenditure<br />
Average<br />
personnel<br />
cost per<br />
employee<br />
(R’000)<br />
Number of<br />
employees<br />
on 1 April<br />
<strong>2014</strong><br />
1 234 097 121 938 1 103 1 349 52.09 367 283 332<br />
2 45 683 34 614 76 <strong>15</strong>6 75.77 509 029 68<br />
3 30 443 955 39 093 0 10 0.13 482 630 81<br />
4 6 035 801 80 827 473 0 1.34 383 066 211<br />
5 105 985 71 606 68 0 67.56 260 385 275<br />
Sub total 36 865 521 348 078 1 720 1 5<strong>15</strong> 0.94 359 957 967<br />
Statutory 13 838 799 0 0 0 0 0 0<br />
Total 50 704 320 348 078 1 720 1 5<strong>15</strong> 0.69 359 957 967<br />
TABLE 1.2 – Personnel costs by salary bands, 1 April <strong>2014</strong> to 31 March 20<strong>15</strong><br />
Salary band<br />
Personnel<br />
expenditure<br />
(R’000)<br />
% of total<br />
personnel cost<br />
Average<br />
personnel cost<br />
per employee<br />
(R’000)<br />
1 430 0.41 71 486<br />
Skilled (Levels 3-5) 53 209 <strong>15</strong>.29 146 178<br />
Highly skilled production (Levels 6-8) 69 565 19.99 292 290<br />
Highly skilled supervision (Levels 9-12) 141 844 40.75 535 261<br />
Senior Management (Levels 13-16) 82 030 23.57 1 025 379<br />
Total 348 078 100.00 359 957<br />
<br />
<br />
<br />
TABLE 1.3 – Salaries, Overtime, Home Owner’s Allowance and Medical Assistance by programme,<br />
1 April <strong>2014</strong> to 31 March 20<strong>15</strong><br />
Programme<br />
Personnel<br />
costs<br />
(R‘000)<br />
Salaries<br />
Amount<br />
(R’000)<br />
Salaries<br />
as a % of<br />
personnel<br />
cost<br />
Amount<br />
(R’000)<br />
Overtime<br />
Overtime<br />
as a % of<br />
personnel<br />
cost<br />
Home Owner’s<br />
Allowance (HOA) Medical Assistance<br />
Amount<br />
(R’000)<br />
HOA as<br />
a % of<br />
personnel<br />
cost<br />
Amount<br />
(R’000)<br />
Medical<br />
assistance<br />
as a % of<br />
personnel<br />
cost<br />
1 121 938 83 310 68.32 2 <strong>15</strong>7 1.77 2 652 2.17 3 798 3.11<br />
2 34 614 24 207 69.93 0 0.00 622 1.80 774 2.24<br />
3 39 093 27 738 70.95 24 0.06 478 1.22 869 2.22<br />
4 80827 55457 68.61 3 083 3.81 1 778 2.20 2 747 3.40<br />
5 71 606 49 738 69.46 2166 3.02 2 3<strong>15</strong> 3.23 3 746 5.23<br />
Total 348 078 240 450 69.08 7 430 2.13 7 845 2.25 11 934 3.43<br />
104