

ANNUAL REPORT 2014/15
DHET Annual Report 2014-2015
DHET Annual Report 2014-2015

You also want an ePaper? Increase the reach of your titles
YUMPU automatically turns print PDFs into web optimized ePapers that Google loves.
DEPARTMENT OF HIGHER EDUCATION AND TRAINING<br />
Vote 17<br />
<strong>2014</strong>/<strong>15</strong> Annual Report<br />
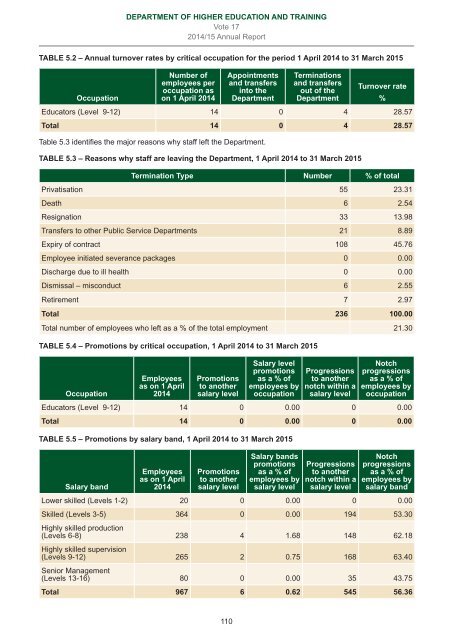
TABLE 5.2 – Annual turnover rates by critical occupation for the period 1 April <strong>2014</strong> to 31 March 20<strong>15</strong><br />
Occupation<br />
Number of<br />
employees per<br />
occupation as<br />
on 1 April <strong>2014</strong><br />
Appointments<br />
and transfers<br />
into the<br />
Department<br />
Terminations<br />
and transfers<br />
out of the<br />
Department<br />
Turnover rate<br />
%<br />
Educators (Level 9-12) 14 0 4 28.57<br />
Total 14 0 4 28.57<br />
<br />
TABLE 5.3 – Reasons why staff are leaving the Department, 1 April <strong>2014</strong> to 31 March 20<strong>15</strong><br />
Termination Type Number % of total<br />
Privatisation 55 23.31<br />
Death 6 2.54<br />
Resignation 33 13.98<br />
Transfers to other Public Service Departments 21 8.89<br />
Expiry of contract 108 45.76<br />
Employee initiated severance packages 0 0.00<br />
Discharge due to ill health 0 0.00<br />
Dismissal – misconduct 6 2.55<br />
Retirement 7 2.97<br />
Total 236 100.00<br />
21.30<br />
TABLE 5.4 – Promotions by critical occupation, 1 April <strong>2014</strong> to 31 March 20<strong>15</strong><br />
Occupation<br />
Employees<br />
as on 1 April<br />
<strong>2014</strong><br />
Promotions<br />
to another<br />
salary level<br />
Salary level<br />
promotions<br />
as a % of<br />
employees by<br />
occupation<br />
Progressions<br />
to another<br />
notch within a<br />
salary level<br />
Notch<br />
progressions<br />
as a % of<br />
employees by<br />
occupation<br />
Educators (Level 9-12) 14 0 0.00 0 0.00<br />
Total 14 0 0.00 0 0.00<br />
TABLE 5.5 – Promotions by salary band, 1 April <strong>2014</strong> to 31 March 20<strong>15</strong><br />
Salary band<br />
Employees<br />
as on 1 April<br />
<strong>2014</strong><br />
Promotions<br />
to another<br />
salary level<br />
Salary bands<br />
promotions<br />
as a % of<br />
employees by<br />
salary level<br />
Progressions<br />
to another<br />
notch within a<br />
salary level<br />
Notch<br />
progressions<br />
as a % of<br />
employees by<br />
salary band<br />
20 0 0.00 0 0.00<br />
Skilled (Levels 3-5) 364 0 0.00 194 53.30<br />
Highly skilled production<br />
(Levels 6-8) 238 4 1.68 148 62.18<br />
Highly skilled supervision<br />
(Levels 9-12) 265 2 0.75 168 63.40<br />
Senior Management<br />
(Levels 13-16) 80 0 0.00 35 43.75<br />
Total 967 6 0.62 545 56.36<br />
110