cities
SoCR16%20Main%20Report%20online
SoCR16%20Main%20Report%20online

Create successful ePaper yourself
Turn your PDF publications into a flip-book with our unique Google optimized e-Paper software.
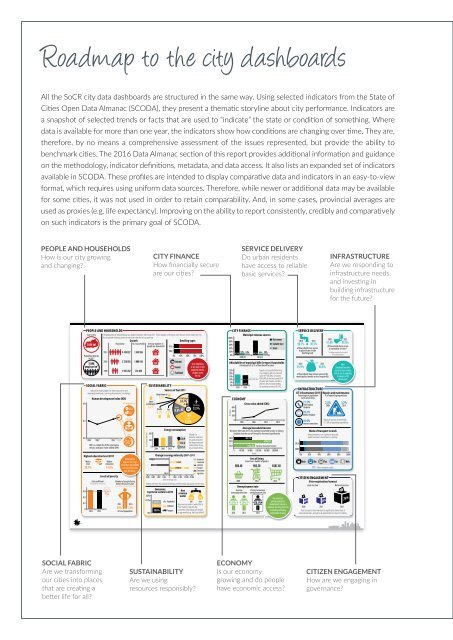
Roadmap to the city dashboards<br />
All the SoCR city data dashboards are structured in the same way. Using selected indicators from the State of<br />
Cities Open Data Almanac (SCODA), they present a thematic storyline about city performance. Indicators are<br />
a snapshot of selected trends or facts that are used to “indicate” the state or condition of something. Where<br />
data is available for more than one year, the indicators show how conditions are changing over time. They are,<br />
therefore, by no means a comprehensive assessment of the issues represented, but provide the ability to<br />
benchmark <strong>cities</strong>. The 2016 Data Almanac section of this report provides additional information and guidance<br />
on the methodology, indicator definitions, metadata, and data access. It also lists an expanded set of indicators<br />
available in SCODA. These profiles are intended to display comparative data and indicators in an easy-to-view<br />
format, which requires using uniform data sources. Therefore, while newer or additional data may be available<br />
for some <strong>cities</strong>, it was not used in order to retain comparability. And, in some cases, provincial averages are<br />
used as proxies (e.g. life expectancy). Improving on the ability to report consistently, credibly and comparatively<br />
on such indicators is the primary goal of SCODA.<br />
PEOPLE AND HOUSEHOLDS<br />
How is our city growing<br />
and changing?<br />
CITY FINANCE<br />
How financially secure<br />
are our <strong>cities</strong>?<br />
SERVICE DELIVERY<br />
Do urban residents<br />
have access to reliable<br />
basic services?<br />
INFRASTRUCTURE<br />
Are we responding to<br />
infrastructure needs<br />
and investing in<br />
building infrastructure<br />
for the future?<br />
PEOPLE AND HOUSEHOLDS<br />
Size of city The population of Johannesburg has doubled between 2001 and 2011. Fewer people are living in more houses which means the City<br />
has to provide infrastructure at a rate faster than the city is growing.<br />
Growth<br />
Dwelling types<br />
1 644 km 2 Population No. households Average number of<br />
people per household 2011<br />
2001<br />
2011 4 434 827 1 434 856<br />
3.09<br />
Population density<br />
0% 25% 50% 75% 100%<br />
in 2011<br />
2001 3 226 055 1 006 910<br />
Informal<br />
2 696<br />
3.20<br />
Go to StepSA.org<br />
people per km 2<br />
Formal<br />
to see maps on how<br />
population density<br />
1996 2 597 282 732 845<br />
3.54<br />
Traditional changes across<br />
the city.<br />
0.8<br />
0.7<br />
SOCIAL FABRIC<br />
Joburg has made progress in reducing poverty and<br />
improving livelihoods, but inequality remains a challenge.<br />
Matric<br />
level<br />
28.7%<br />
Human development index (HDI)<br />
Life expectancy<br />
63.3<br />
61.7<br />
0.6<br />
1996 2001 2011 2013<br />
HDI is a composite of life expectancy,<br />
literacy and gross value added (GVA)<br />
Highest education level 2011<br />
0.6<br />
0.4<br />
0.2<br />
0<br />
Gini coefficient<br />
(inequality measure)<br />
2011 2013<br />
Higher<br />
education<br />
14.6%<br />
Levels of poverty<br />
VERY HIGH<br />
INEQUALITY<br />
Literacy<br />
92%<br />
GVA<br />
R515.72<br />
billions<br />
Urban safety is<br />
important for a city’s<br />
social fabric; go to SCODA<br />
to access urban safety<br />
data for Joburg..<br />
Number of people living<br />
below the poverty line<br />
2011 2013<br />
29% 21%<br />
of total population<br />
GJ (millions) per year<br />
SUSTAINABILITY<br />
Sources of fuel 2011<br />
200<br />
100<br />
0<br />
Heavy furnace oil<br />
0.1%<br />
Liquid<br />
petroleum/gas<br />
0.1%<br />
Paraffi n<br />
0.1%<br />
2004 2007 2011<br />
Diesel<br />
Coal 14.8%<br />
2.8%<br />
Jet fuel & avgas<br />
14.7%<br />
Energy consumption<br />
130.9<br />
142.6<br />
175.7<br />
Electricity<br />
2011 33.5%<br />
Petrol<br />
33.9%<br />
Joburg is a<br />
resource-intensive<br />
city and consumes<br />
the largest amount<br />
of electricity of any<br />
city in South Africa.<br />
Change in energy intensity 2007–2011<br />
-7 522.2<br />
Residential<br />
5 248.9<br />
Commercial<br />
-6 722.4<br />
Industrial<br />
24 996.6<br />
Transport<br />
2.1<br />
Government<br />
-205.6<br />
Agriculture<br />
-8 000 -6 000 -4 000 -2 000 0 2 000 4 000 20 000 30 000<br />
Units of energy in GJ<br />
Energy intensity: the amount of energy used for producing goods and services.<br />
Emissions:<br />
top three sectors in 2015<br />
Non<br />
revenue<br />
100%<br />
water<br />
29% 25%<br />
73.8%<br />
20.8% Residential<br />
2007 2014<br />
Non revenue water is water that is<br />
22.4% Industrial<br />
“lost” before it reaches the<br />
30.6% Transport customer, either physically (leaks)<br />
0%<br />
or apparently (e.g. theft, not billed)<br />
CITY FINANCE<br />
Municipal revenue sources<br />
100%<br />
Own revenue<br />
80%<br />
60%<br />
Equitable share<br />
40%<br />
Grants<br />
20%<br />
9.6% 8.9% 6.9% 9.0%<br />
81.5% 84.1%<br />
0%<br />
2008/09 2013/14<br />
Affordability of municipal bills for type A households<br />
(municipal bill as % of benchmark income)<br />
25%<br />
20%<br />
15%<br />
10%<br />
5%<br />
0%<br />
R-billions<br />
ECONOMY<br />
Gross value added (GVA)<br />
600<br />
400<br />
200<br />
0<br />
1996 2001 2011 2013<br />
Cost of living<br />
(based on a bundle of goods)<br />
R80.40 R93.20 R107.80<br />
2008 2011 2014<br />
Unemployment rate<br />
Average<br />
Provincial average<br />
unemployment rate<br />
unemployment rate<br />
37% 25%<br />
2001 2011<br />
26.3%<br />
2011<br />
Type A is a household that lives<br />
in a property with an assessed<br />
value of R100,000, consumes<br />
400 kWh of electricity and 20 kl<br />
of water per month, and has a<br />
240 litre bin removed weekly.<br />
Its monthly income is R6 742.<br />
Average household income<br />
Between 2001 and 2011, the average household income in Joburg<br />
doubled, but the cost of living also increased significantly<br />
2001<br />
2011<br />
18.1% 16.8%<br />
2010 2014<br />
R89 728<br />
AFFORDABILITY<br />
R183 247<br />
2011 R103 204 National household income<br />
0 40 000 80 000 120 000 160 000 200 000<br />
Rands<br />
The economy is<br />
growing rapidly, but<br />
unemployment remains a<br />
challenge and living in the city<br />
is becoming increasing<br />
unaffordable for many.<br />
SERVICE DELIVERY<br />
2010<br />
2013<br />
90.7% 90.5%<br />
of households have access<br />
to piped water inside<br />
dwelling/yard<br />
2010<br />
95.9%<br />
of households have refuse removed by<br />
municipality (weekly or less frequently)<br />
INFRASTRUCTURE<br />
ICT infrastructure 2011 Repairs and maintenance<br />
Percentage of population % of operating expenditure<br />
with connections<br />
2013<br />
2003<br />
21.2%<br />
Fixed-landline<br />
telephone<br />
94.4%<br />
Mobile telephone<br />
49.6%<br />
Internet connections<br />
Mode of transport to work<br />
Joburg remains a car-captive society, and<br />
public transport investment is a priority.<br />
Train Bus TAXI Taxi Car Walk<br />
Other transport modes<br />
CITIZEN ENGAGEMENT<br />
Voter registration/turnout<br />
Local election<br />
National election<br />
40%<br />
2013<br />
96.8%<br />
2006 2011<br />
2.3%<br />
2009<br />
3.2%<br />
2014<br />
National Treasury recommends<br />
8–10% of operating expenditure<br />
0% 20% 40% 60% 80% 100%<br />
55%<br />
2010<br />
2013<br />
97.8% 98.5%<br />
of households have access<br />
to sanitation services*<br />
* includes access to flush toilets,<br />
VIPs and pit toilets<br />
Most<br />
households now have<br />
access to basic services<br />
and the city is expanding<br />
its network of ICT<br />
infrastructure.<br />
2014<br />
74%<br />
Voter turnout at local elections is significantly lower than at<br />
national elections, and yet local government is closest to citizens.<br />
SOCIAL FABRIC<br />
Are we transforming<br />
our <strong>cities</strong> into places<br />
that are creating a<br />
better life for all?<br />
SUSTAINABILITY<br />
Are we using<br />
resources responsibly?<br />
ECONOMY<br />
Is our economy<br />
growing and do people<br />
have economic access?<br />
CITIZEN ENGAGEMENT<br />
How are we engaging in<br />
governance?