- Page 1 and 2:
4.4 Book 1 - Basics
- Page 3 and 4:
Introduction ......................
- Page 5 and 6:
Comment Log .......................
- Page 7 and 8:
Introduction INTRODUCTION - I Licen
- Page 9 and 10:
INTRODUCTION - III running a Flexne
- Page 11 and 12:
Book 1 - WellCAD Basics BOOK 1 - WE
- Page 13 and 14:
BOOK 1 - WELLCAD BASICS - 3 The Tit
- Page 15 and 16:
1.2.1.1 Reader Module BOOK 1 - WELL
- Page 17 and 18:
1.2.3 Draft, Presentation and Print
- Page 19 and 20:
1.2.4.1 Switching between documents
- Page 21 and 22:
BOOK 1 - WELLCAD BASICS - 11 Usuall
- Page 23 and 24:
Display Styles: 1.3.1.3 Depth Colum
- Page 25 and 26:
1.3.1.5 Marker Log Display Styles:
- Page 27 and 28:
1.3.1.7 CoreDesc Log Display Styles
- Page 29 and 30:
1.3.1.9 Strata Log Display Styles:
- Page 31 and 32:
Data Format: BOOK 1 - WELLCAD BASIC
- Page 33 and 34:
1.3.1.12 Full Wave Sonic Log Descri
- Page 35 and 36:
BOOK 1 - WELLCAD BASICS - 25 1.3.1.
- Page 37 and 38:
1.3.1.16 Analysis Log Display Style
- Page 39 and 40:
1.3.1.18 Structure Log Display Styl
- Page 41 and 42:
1.3.1.19 Breakout Log Description:
- Page 43 and 44:
1.3.1.21 Engineering Log Descriptio
- Page 45 and 46:
1.3.1.23 Polar & Rose Log Descripti
- Page 47 and 48:
1.3.1.25 3D Log Display Styles: Des
- Page 49 and 50:
BOOK 1 - WELLCAD BASICS - 39 An alt
- Page 51 and 52:
1.3.2.3 Naming Logs Right click on
- Page 53 and 54:
Tick to enable snap to specified mu
- Page 55 and 56:
To display the Document Layout Bar:
- Page 57 and 58:
After aligning logs side-by-side In
- Page 59 and 60:
BOOK 1 - WELLCAD BASICS - 49 Log wi
- Page 61 and 62:
1.3.2.7 Depth Shifting Logs BOOK 1
- Page 63 and 64:
1.3.2.9 Extending Logs 1.3.2.10 Cut
- Page 65 and 66:
BOOK 1 - WELLCAD BASICS - 55 � Pr
- Page 67 and 68:
1.3.2.13 Comparing Log Data - The T
- Page 69 and 70:
1.3.2.15 Find and Replace data BOOK
- Page 71 and 72:
BOOK 1 - WELLCAD BASICS - 61 Check
- Page 73 and 74:
General settings: Check to hide the
- Page 75 and 76:
1.3.3.2 Main Settings Background: B
- Page 77 and 78:
BOOK 1 - WELLCAD BASICS - 67 Or �
- Page 79 and 80:
1.3.3.4 Copy Settings between Logs
- Page 81 and 82:
1.4 Basic Document Editing 1.4.1 De
- Page 83 and 84:
BOOK 1 - WELLCAD BASICS - 73 Note:
- Page 85 and 86:
BOOK 1 - WELLCAD BASICS - 75 measur
- Page 87 and 88:
1.4.2 Data Import BOOK 1 - WELLCAD
- Page 89 and 90:
To use an alias table during import
- Page 91 and 92:
BOOK 1 - WELLCAD BASICS - 81 Use Al
- Page 93 and 94:
List of data channels contained in
- Page 95 and 96:
BOOK 1 - WELLCAD BASICS - 85 Previe
- Page 97 and 98:
BOOK 1 - WELLCAD BASICS - 87 repres
- Page 99 and 100:
Click to select the channels to imp
- Page 101 and 102:
BOOK 1 - WELLCAD BASICS - 91 config
- Page 103 and 104:
Preview of the embedded configurati
- Page 105 and 106:
Selected Files: BOOK 1 - WELLCAD BA
- Page 107 and 108:
BOOK 1 - WELLCAD BASICS - 97 The DL
- Page 109 and 110:
BOOK 1 - WELLCAD BASICS - 99 WellCA
- Page 111 and 112:
BOOK 1 - WELLCAD BASICS - 101 The d
- Page 113 and 114:
Switch between header and trailer s
- Page 115 and 116:
Empty dynamic text fields Interacti
- Page 117 and 118:
BOOK 1 - WELLCAD BASICS - 107 Dialo
- Page 119 and 120:
BOOK 1 - WELLCAD BASICS - 109 1.4.4
- Page 121 and 122:
Enabled when data overlap must be h
- Page 123 and 124:
BOOK 1 - WELLCAD BASICS - 113 Gamma
- Page 125 and 126:
1.4.5 Data Export BOOK 1 - WELLCAD
- Page 127 and 128:
1.4.5.2 Generating a LAS File BOOK
- Page 129 and 130:
BOOK 1 - WELLCAD BASICS - 119 � S
- Page 131 and 132:
1.4.6.2 Page Setup BOOK 1 - WELLCAD
- Page 133 and 134:
1.4.6.3 Print Preview and Print BOO
- Page 135 and 136:
BOOK 1 - WELLCAD BASICS - 125 Const
- Page 137 and 138:
Formula for Vsh BOOK 1 - WELLCAD BA
- Page 139 and 140:
Code recorded as data, it refers to
- Page 141 and 142:
BOOK 1 - WELLCAD BASICS - 131 Examp
- Page 143 and 144:
BOOK 1 - WELLCAD BASICS - 133 Conta
- Page 145 and 146:
1.5.5 Setting up Classifications BO
- Page 147 and 148:
BOOK 1 - WELLCAD BASICS - 137 The f
- Page 149 and 150:
BOOK 1 - WELLCAD BASICS - 139 Dialo
- Page 151 and 152:
BOOK 1 - WELLCAD BASICS - 141 Litho
- Page 153 and 154:
BOOK 1 - WELLCAD BASICS - 143 If We
- Page 155 and 156:
1.5.11 Correcting Data for Borehole
- Page 157 and 158:
Note: 1.5.12.1 Azimuth and Tilt BOO
- Page 159 and 160:
1.5.12.2 Easting, Northing and TVD
- Page 161 and 162:
Balanced Tangential: Coordinates of
- Page 163 and 164:
BOOK 1 - WELLCAD BASICS - 153 Input
- Page 165 and 166:
1.5.13.3 Drift Correction Spectrum
- Page 167 and 168:
BOOK 1 - WELLCAD BASICS - 157 Log:
- Page 169 and 170:
1.5.13.7 Window Based Model BOOK 1
- Page 171 and 172:
Remarks Tab Model Design Tab Window
- Page 173 and 174:
BOOK 1 - WELLCAD BASICS - 163 The i
- Page 175 and 176:
Log containing the measurements (sp
- Page 177 and 178:
2 nd element (e.g. U): BOOK 1 - WEL
- Page 179 and 180:
Where �WK � � C � � �
- Page 181 and 182:
1.5.14 Hole Volume Calculation BOOK
- Page 183 and 184:
Unit: BOOK 1 - WELLCAD BASICS - 173
- Page 185 and 186:
Interval: Select a log dealing with
- Page 187 and 188:
Inserting intervals: After selectin
- Page 189 and 190:
To display the Annotation Bar: �
- Page 191 and 192:
Begin is where you clicked to draw
- Page 193 and 194:
1.6.1.3 Callout Annotation BOOK 1 -
- Page 195 and 196:
List of existing layers Click to al
- Page 197 and 198:
1.7.1.2 Creating Anchor Points Link
- Page 199 and 200:
Common link lines and their effect
- Page 201 and 202:
BOOK 1 - WELLCAD BASICS - 191 If yo
- Page 203 and 204:
BOOK 1 - WELLCAD BASICS - 193 Tilt
- Page 205 and 206:
Select the depth reference that cor
- Page 207 and 208:
BOOK 1 - WELLCAD BASICS - 197 Step
- Page 209 and 210:
BOOK 1 - WELLCAD BASICS - 199 The m
- Page 211 and 212:
BOOK 1 - WELLCAD BASICS - 201 Date/
- Page 213 and 214:
BOOK 1 - WELLCAD BASICS - 203 Orien
- Page 215 and 216:
BOOK 1 - WELLCAD BASICS - 205 Cross
- Page 217 and 218:
1.8.1.2 Chart Settings Chart Title
- Page 219 and 220:
1.8.1.4 Depth Range Selection BOOK
- Page 221 and 222:
1.8.2.2 Log Overview Axis Settings
- Page 223 and 224:
BOOK 1 - WELLCAD BASICS - 213 Highl
- Page 225 and 226:
1.8.2.3 Cluster Statistics 1.8.3 Bu
- Page 227 and 228:
Creating a Cluster � Move your cu
- Page 229 and 230:
1.8.4 Adding Regression 1.8.4.1 Reg
- Page 231 and 232:
1.8.4.2 Regression Data Source 1.8.
- Page 233 and 234:
BOOK 1 - WELLCAD BASICS - 223 Right
- Page 235 and 236:
Annotation Clusters Legend Plot Leg
- Page 237 and 238:
Plot Legend BOOK 1 - WELLCAD BASICS
- Page 239 and 240:
1.8.5.2 Inserting Annotations BOOK
- Page 241 and 242:
Appendix A APPENDIX A - 231 The fol
- Page 243 and 244:
Display Styles: Well Log data is al
- Page 245 and 246:
APPENDIX A - 235 Scale: The horizon
- Page 247 and 248:
Select the presentation style for e
- Page 249 and 250:
Classification: APPENDIX A - 239 Cl
- Page 251 and 252:
APPENDIX A - 241 Copy: Copies the d
- Page 253 and 254:
Mud Log Description: APPENDIX A - 2
- Page 255 and 256:
APPENDIX A - 245 Scale: The horizon
- Page 257 and 258:
APPENDIX A - 247 polarity positive
- Page 259 and 260:
APPENDIX A - 249 correct depth. A c
- Page 261 and 262:
Editing Methods: APPENDIX A - 251 T
- Page 263 and 264:
Shift by: Performs a constant depth
- Page 265 and 266:
APPENDIX A - 255 Mud Log to Litho L
- Page 267 and 268:
� Open the Edit > Insert New Log
- Page 269 and 270:
APPENDIX A - 259 Position: The dept
- Page 271 and 272:
APPENDIX A - 261 Items Count: For e
- Page 273 and 274:
APPENDIX A - 263 Cut: Copies the da
- Page 275 and 276:
Interval Log Description: APPENDIX
- Page 277 and 278:
APPENDIX A - 267 Scale: The horizon
- Page 279 and 280:
Classified Bar: Classified Bar styl
- Page 281 and 282:
APPENDIX A - 271 In some cases it m
- Page 283 and 284:
APPENDIX A - 273 Inserting data:
- Page 285 and 286:
Conversion to other log types: APPE
- Page 287 and 288:
Comment Log Description: APPENDIX A
- Page 289 and 290:
Format: APPENDIX A - 279 From left
- Page 291 and 292:
Editing Methods: APPENDIX A - 281 C
- Page 293 and 294:
APPENDIX A - 283 The following opti
- Page 295 and 296:
APPENDIX A - 285 Defaults can be se
- Page 297 and 298:
Inserting a new Marker Log: APPENDI
- Page 299 and 300:
Name Dictionary: APPENDIX A - 289 T
- Page 301 and 302:
Flying Menu: Settings: Get access t
- Page 303 and 304:
CoreDesc Log Description: APPENDIX
- Page 305 and 306:
Main Settings: Title: Core Descript
- Page 307 and 308:
Background hidden (right) to enhanc
- Page 309 and 310:
To re-position the entire interval:
- Page 311 and 312:
APPENDIX A - 301 When sorting is pe
- Page 313 and 314:
Lithology Log Description: APPENDIX
- Page 315 and 316:
APPENDIX A - 305 WellCAD. LTH libra
- Page 317 and 318:
Primary: Bed limits and contact lin
- Page 319 and 320:
Select a pattern that will be used
- Page 321 and 322:
Litho Bar attached to WellCAD Works
- Page 323 and 324:
Delete: Removes the log and its dat
- Page 325 and 326:
Pattern Dictionary: Lithology Log d
- Page 327 and 328:
Display Styles: APPENDIX A - 317 St
- Page 329 and 330:
APPENDIX A - 319 Column Settings: T
- Page 331 and 332:
APPENDIX A - 321 Left: Strata colum
- Page 333 and 334:
Box Style set to Center, Left, Righ
- Page 335 and 336:
Inserting Data: Click to insert fre
- Page 337 and 338:
APPENDIX A - 327 The following opti
- Page 339 and 340:
Stacking Pattern Log Description: A
- Page 341 and 342:
APPENDIX A - 331 Title: Enter the t
- Page 343 and 344:
APPENDIX A - 333 Changing top and b
- Page 345 and 346:
Conversion of stacking pattern inte
- Page 347 and 348:
OLE Log Description: APPENDIX A - 3
- Page 349 and 350:
Tool Bar and Menu Bar from EXCEL Ne
- Page 351 and 352:
Main Settings: Title: OLE Log Setti
- Page 353 and 354:
Slice at: Splits the data set into
- Page 355 and 356:
Inserting a new FWS Log: APPENDIX A
- Page 357 and 358:
APPENDIX A - 347 upper and lower pa
- Page 359 and 360:
Default Settings: APPENDIX A - 349
- Page 361 and 362:
Inserting a new VSP Log: APPENDIX A
- Page 363 and 364:
Editing Methods: APPENDIX A - 353 V
- Page 365 and 366:
APPENDIX A - 355 Image Log / Image
- Page 367 and 368:
Main Settings: Title: Select the We
- Page 369 and 370:
APPENDIX A - 359 The Shifted Curve
- Page 371 and 372:
APPENDIX A - 361 Copy: Copies the d
- Page 373 and 374:
RGB Log Description: APPENDIX A - 3
- Page 375 and 376:
Flying Menu: RGB Log Flying Menu AP
- Page 377 and 378:
RGB Log to Image Log conversion APP
- Page 379 and 380:
APPENDIX A - 369 Line style: Data p
- Page 381 and 382:
Style: APPENDIX A - 371 The Analysi
- Page 383 and 384:
APPENDIX A - 373 Clicking the Advan
- Page 385 and 386:
APPENDIX A - 375 Adjust the depth r
- Page 387 and 388:
APPENDIX A - 377 Continue inserting
- Page 389 and 390:
Default Settings: APPENDIX A - 379
- Page 391 and 392:
Main Settings: Title: Percentage Lo
- Page 393 and 394:
Line Style: Line style APPENDIX A -
- Page 395 and 396:
APPENDIX A - 385 The Analysis Compo
- Page 397 and 398:
Flying Menu: Percentage Log Flying
- Page 399 and 400:
APPENDIX A - 389 The default patter
- Page 401 and 402:
W S N E APPENDIX A - 391 N E S W N
- Page 403 and 404:
Additional Attributes: APPENDIX A -
- Page 405 and 406:
Caliper button: Structure Log in Pr
- Page 407 and 408:
Tadpole: Structure Tadpole style se
- Page 409 and 410:
Editing Methods: APPENDIX A - 399 N
- Page 411 and 412:
APPENDIX A - 401 sine wave that wil
- Page 413 and 414:
APPENDIX A - 403 Clear Contents: Er
- Page 415 and 416:
Breakout Log Description: APPENDIX
- Page 417 and 418:
Title: APPENDIX A - 407 Enter the t
- Page 419 and 420:
Breakout projection style settings
- Page 421 and 422:
To delete a breakout pick: � Sele
- Page 423 and 424:
Default Settings: APPENDIX A - 413
- Page 425 and 426:
Inserting a new Bio Log: APPENDIX A
- Page 427 and 428:
APPENDIX A - 417 Position: You can
- Page 429 and 430: APPENDIX A - 419 When opening the H
- Page 431 and 432: APPENDIX A - 421 Style: If the Disp
- Page 433 and 434: Flying Menu: Bio Log Flying Menu AP
- Page 435 and 436: Engineering Log Description: APPEND
- Page 437 and 438: Display Styles: APPENDIX A - 427 En
- Page 439 and 440: Full, Left and Right display styles
- Page 441 and 442: Drill Item Example of a log with th
- Page 443 and 444: Flying Menu: Engineering Log Flying
- Page 445 and 446: Shading Log Description: APPENDIX A
- Page 447 and 448: APPENDIX A - 437 Copy: Copies the d
- Page 449 and 450: Inserting A New 3D Log: APPENDIX A
- Page 451 and 452: Title: APPENDIX A - 441 Enter the t
- Page 453 and 454: Frame: APPENDIX A - 443 If no Frame
- Page 455 and 456: APPENDIX A - 445 Select the log tha
- Page 457: Default Settings: APPENDIX A - 447
- Page 460 and 461: 450 - APPENDIX A www.alt.lu Breakou
- Page 462 and 463: 452 - APPENDIX A www.alt.lu Box: Po
- Page 464 and 465: 454 - APPENDIX A www.alt.lu Rose Di
- Page 466 and 467: 456 - APPENDIX A www.alt.lu Mean Di
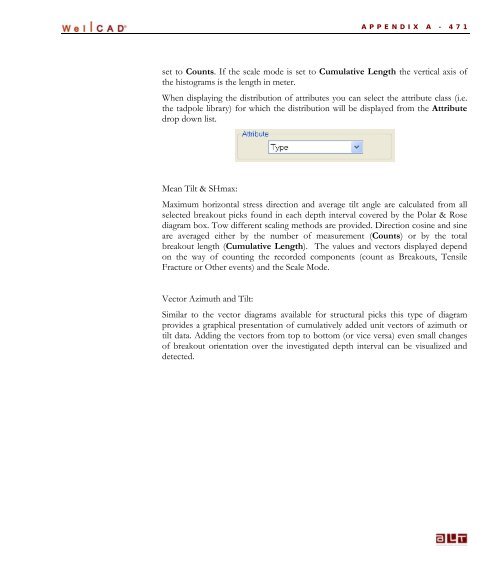
- Page 468 and 469: 458 - APPENDIX A www.alt.lu For pur
- Page 470 and 471: 460 - APPENDIX A www.alt.lu Grid: Y
- Page 472 and 473: 462 - APPENDIX A www.alt.lu Rose Az
- Page 474 and 475: 464 - APPENDIX A www.alt.lu Concent
- Page 476 and 477: 466 - APPENDIX A www.alt.lu Vector
- Page 478 and 479: 468 - APPENDIX A www.alt.lu Rose Di
- Page 482 and 483: 472 - APPENDIX A www.alt.lu Editing
- Page 484 and 485: 474 - APPENDIX A www.alt.lu Fill: A
- Page 486 and 487: 476 - APPENDIX A Cross Section Log
- Page 488 and 489: 478 - APPENDIX A www.alt.lu Data dr
- Page 490 and 491: 480 - APPENDIX A www.alt.lu extensi
- Page 492 and 493: 482 - APPENDIX A www.alt.lu � Cli
- Page 494 and 495: 484 - APPENDIX A www.alt.lu Default
- Page 496 and 497: 486 - APPENDIX B Tool Bar www.alt.l
- Page 498 and 499: 488 - APPENDIX B www.alt.lu Toggle
- Page 500 and 501: 490 - APPENDIX B Pen Bar www.alt.lu
- Page 502 and 503: 492 - APPENDIX B Document Layout Ba
- Page 505 and 506: Appendix C Listed are all functions
- Page 507 and 508: Power( A, P ) Returns argument (A)
- Page 509 and 510: Index 3 3D Log · 37, 438 3D Log Ma
- Page 511 and 512: Deleting Logs · 39 Depth Axis · 7
- Page 513 and 514: Marker position · 148 Mask horizon
- Page 515: Structure Log Editing · 399 Struct