Elevatori Magazine 3-2023
May - June 2023
May - June 2023

Create successful ePaper yourself
Turn your PDF publications into a flip-book with our unique Google optimized e-Paper software.
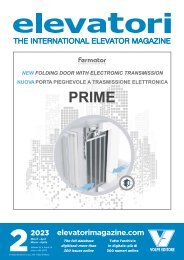
To offer a simpler model accounting for<br />
traffic and passenger handling strategies, one<br />
simulation package [11] offers a simple on/off<br />
model for the drive at different directions and<br />
loads.<br />
The equivalent power consumptions curves in<br />
Figure 10 become Figure 11.<br />
Per offrire un modello più semplice, che<br />
rappresenti le strategie di gestione del traffico e<br />
dei passeggeri, un pacchetto di simulazione [11]<br />
fornisce un semplice modello on/off per la guida in<br />
diverse direzioni e carichi. Le curve dei consumi<br />
energetici equivalenti della Figura 10 diventano<br />
quelle della Figura 11.<br />
Power / Potenza (kW)<br />
Time (seconds) / Tempo (secondi)<br />
Up / Salita 1800 kg<br />
Down / Discesa 0 kg<br />
Up / Salita 1350 kg<br />
Down / Discesa 450 kg<br />
Down / Discesa 900 kg<br />
Up / Salita 900 kg<br />
Up / Salita 450 kg<br />
Down / Discesa 1350 kg<br />
Up / Salita 0 kg<br />
Down / Discesa 1800 kg<br />
Figure 11 - On/off energy consumption model. / Figura 11 - Modello di consumo energetico on/off.<br />
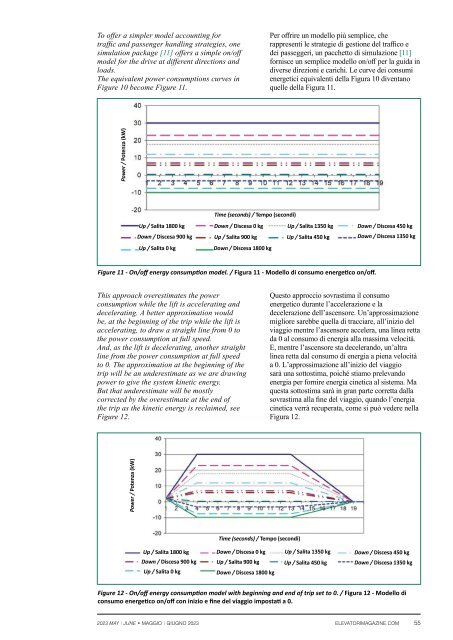
This approach overestimates the power<br />
consumption while the lift is accelerating and<br />
decelerating. A better approximation would<br />
be, at the beginning of the trip while the lift is<br />
accelerating, to draw a straight line from 0 to<br />
the power consumption at full speed.<br />
And, as the lift is decelerating, another straight<br />
line from the power consumption at full speed<br />
to 0. The approximation at the beginning of the<br />
trip will be an underestimate as we are drawing<br />
power to give the system kinetic energy.<br />
But that underestimate will be mostly<br />
corrected by the overestimate at the end of<br />
the trip as the kinetic energy is reclaimed, see<br />
Figure 12.<br />
Questo approccio sovrastima il consumo<br />
energetico durante lʼaccelerazione e la<br />
decelerazione dellʼascensore. Unʼapprossimazione<br />
migliore sarebbe quella di tracciare, allʼinizio del<br />
viaggio mentre lʼascensore accelera, una linea retta<br />
da 0 al consumo di energia alla massima velocità.<br />
E, mentre lʼascensore sta decelerando, unʼaltra<br />
linea retta dal consumo di energia a piena velocità<br />
a 0. Lʼapprossimazione allʼinizio del viaggio<br />
sarà una sottostima, poiché stiamo prelevando<br />
energia per fornire energia cinetica al sistema. Ma<br />
questa sottostima sarà in gran parte corretta dalla<br />
sovrastima alla fine del viaggio, quando lʼenergia<br />
cinetica verrà recuperata, come si può vedere nella<br />
Figura 12.<br />
Power / Potenza (kW)<br />
Time (seconds) / Tempo (secondi)<br />
Up / Salita 1800 kg<br />
Down / Discesa 900 kg<br />
Up / Salita 0 kg<br />
Down / Discesa 0 kg<br />
Up / Salita 900 kg<br />
Down / Discesa 1800 kg<br />
Up / Salita 1350 kg<br />
Up / Salita 450 kg<br />
Down / Discesa 450 kg<br />
Down / Discesa 1350 kg<br />
Figure 12 - On/off energy consumption model with beginning and end of trip set to 0. / Figura 12 - Modello di<br />
consumo energetico on/off con inizio e fine del viaggio impostati a 0.<br />
<strong>2023</strong> MAY | JUNE • MAGGIO | GIUGNO <strong>2023</strong><br />
ELEVATORIMAGAZINE.COM<br />
55