pdf (22.8 MB) - METRO Group
pdf (22.8 MB) - METRO Group
pdf (22.8 MB) - METRO Group

You also want an ePaper? Increase the reach of your titles
YUMPU automatically turns print PDFs into web optimized ePapers that Google loves.
<strong>METRO</strong> GROUP : ANNUAL REPORT 2011 : BUSINESS<br />
→ GROUP MANAGEMENT REPORT : 3. EARNiNGs POsiTiON<br />
eBIT declined by €11 million to €94 million. eBIT before<br />
special items, in turn, rose by €2 million to €134 million. In<br />
Germany, the slight decline in eBIT compared with the previous<br />
year’s level was largely due to the Christmas business.<br />
Meanwhile, the positive eBIT trend in eastern europe<br />
continued, based on cost savings related to shape 2012. In<br />
particular, Russia and poland posted better results.<br />
Media-saturn<br />
Media-saturn reaffirmed its leading market position in europe<br />
in 2011. Despite a challenging economic environment, sales<br />
fell by just 0.9 percent to €20.6 billion in the financial year 2011<br />
(in local currencies: –1.0 percent). This decline in sales is also<br />
attributable to the divestment of the French saturn consumer<br />
electronics stores as of 30 June 2011. like-for-like sales fell<br />
by 4.3 percent. The online retailer Redcoon, which was consolidated<br />
from the third quarter, contributed positively to<br />
sales developments. In 2011, Internet sales including Redcoon<br />
amounted to €348 million.<br />
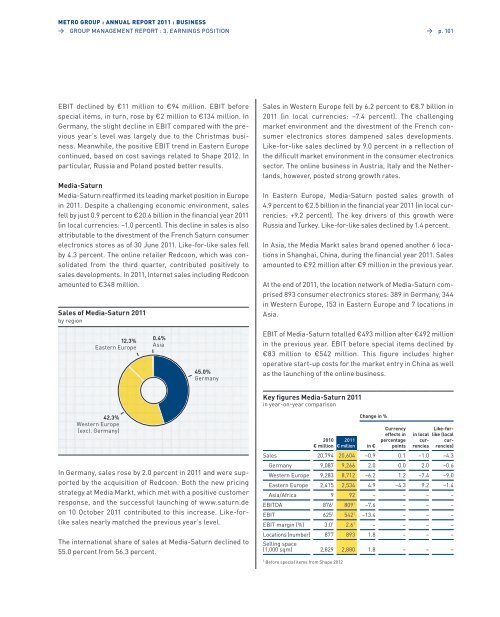
sales of Media-saturn 2011<br />
by region<br />
12.3%<br />
eastern europe<br />
42.3%<br />
Western europe<br />
(excl. Germany)<br />
0.4%<br />
asia<br />
45.0%<br />
Germany<br />
In Germany, sales rose by 2.0 percent in 2011 and were supported<br />
by the acquisition of Redcoon. Both the new pricing<br />
strategy at Media Markt, which met with a positive customer<br />
response, and the successful launching of www.saturn.de<br />
on 10 october 2011 contributed to this increase. like-forlike<br />
sales nearly matched the previous year’s level.<br />
The international share of sales at Media-saturn declined to<br />
55.0 percent from 56.3 percent.<br />
→ p. 101<br />
sales in Western europe fell by 6.2 percent to €8.7 billion in<br />
2011 (in local currencies: –7.4 percent). The challenging<br />
market environment and the divestment of the French consumer<br />
electronics stores dampened sales developments.<br />
like-for-like sales declined by 9.0 percent in a reflection of<br />
the difficult market environment in the consumer electronics<br />
sector. The online business in austria, Italy and the netherlands,<br />
however, posted strong growth rates.<br />
In eastern europe, Media-saturn posted sales growth of<br />
4.9 percent to €2.5 billion in the financial year 2011 (in local currencies:<br />
+9.2 percent). The key drivers of this growth were<br />
Russia and Turkey. like-for-like sales declined by 1.4 percent.<br />
In asia, the Media Markt sales brand opened another 6 locations<br />
in shanghai, China, during the financial year 2011. sales<br />
amounted to €92 million after €9 million in the previous year.<br />
at the end of 2011, the location network of Media-saturn comprised<br />
893 consumer electronics stores: 389 in Germany, 344<br />
in Western europe, 153 in eastern europe and 7 locations in<br />
asia.<br />
eBIT of Media-saturn totalled €493 million after €492 million<br />
in the previous year. eBIT before special items declined by<br />
€83 million to €542 million. This figure includes higher<br />
op erative start-up costs for the market entry in China as well<br />
as the launching of the online business.<br />
Key figures Media-saturn 2011<br />
in year-on-year comparison<br />
Change in %<br />
2010<br />
€ million<br />
2011<br />
€ million in €<br />
Currency<br />
effects in<br />
percentage<br />
points<br />
Like-for-<br />
in local like (local<br />
curcurrenciesrencies) sales 20,794 20,604 –0.9 0.1 –1.0 –4.3<br />
Germany 9,087 9,266 2.0 0.0 2.0 –0.6<br />
Western europe 9,283 8,712 –6.2 1.2 –7.4 –9.0<br />
eastern europe 2,415 2,534 4.9 –4.3 9.2 –1.4<br />
asia/africa 9 92 – – – –<br />
eBITDa 8761 8091 –7.6 – – –<br />
eBIT 6251 5421 –13.4 – – –<br />
eBIT margin (%) 3.01 2.61 – – – –<br />
locations (number)<br />
selling space<br />
877 893 1.8 – – –<br />
(1,000 sqm) 2,829 2,880 1.8 – – –<br />
1 Before special items from shape 2012