pdf (22.8 MB) - METRO Group
pdf (22.8 MB) - METRO Group
pdf (22.8 MB) - METRO Group

Create successful ePaper yourself
Turn your PDF publications into a flip-book with our unique Google optimized e-Paper software.
<strong>METRO</strong> gROUP : ANNUAL REPORT 2011 : BUsiNEss<br />
→ noTes : noTes To THe BalanCe sHeeT<br />
lease payments due in subsequent periods from entities<br />
outside MeTRo GRoUp for the rental of properties that are<br />
legally owned by MeTRo GRoUp (MeTRo GRoUp as lessor)<br />
are shown below:<br />
Up to 1 to Over<br />
€ million<br />
Finance leases 31/12/2010<br />
1 year 5 years 5 years<br />
Future lease payments due (nominal) 4 9 8<br />
Discount 0 –1 –6<br />
present value<br />
Operating leases 31/12/2010<br />
4 8 2<br />
Future lease payments due (nominal) 48 119 131<br />
Up to 1 to Over<br />
€ million<br />
Finance leases 31/12/2011<br />
1 year 5 years 5 years<br />
Future lease payments due (nominal) 4 6 8<br />
Discount 0 –1 –5<br />
present value<br />
Operating leases 31/12/2011<br />
4 5 3<br />
Future lease payments due (nominal) 54 148 192<br />
From the perspective of the lessor, the non-guaranteed<br />
residual value must be added to the nominal minimum lease<br />
payments of €18 million (previous year: €21 million) in existing<br />
finance leases. This amounted to €3 million during the<br />
reporting year (previous year: €3 million). The resulting gross<br />
investment amount is €21 million (previous year: €24 million).<br />
In addition, there is an unrealised amount from finance<br />
leases of €6 million (previous year: €7 million).<br />
21. investment properties<br />
Investment properties are recognised at amortised cost. as<br />
of 31 December 2011, this amounted to €209 million (previous<br />
year: €238 million). The decline of €29 million essentially<br />
results from the scheduled write-down and divestment<br />
transactions. The fair value of these properties is determined<br />
by means of internationally recognised measurement methods,<br />
in particular the comparative value method and the discounted<br />
cash flow method. It totals €298 million (previous<br />
year: €322 million). Rental income from these properties<br />
amounts to €33 million (previous year: €24 million). The<br />
related expenses amount to €23 million (previous year:<br />
€13 million). expenses of €0 million (previous year: €0 million)<br />
resulted from properties without rental income.<br />
→ p. 212<br />
limitations to the disposal of assets in the form of liens<br />
and encumbrances amounted to €31 million (previous year:<br />
€53 million). purchasing obligations for investment properties<br />
in the amount of €0 million (previous year: €5 million)<br />
were made.<br />
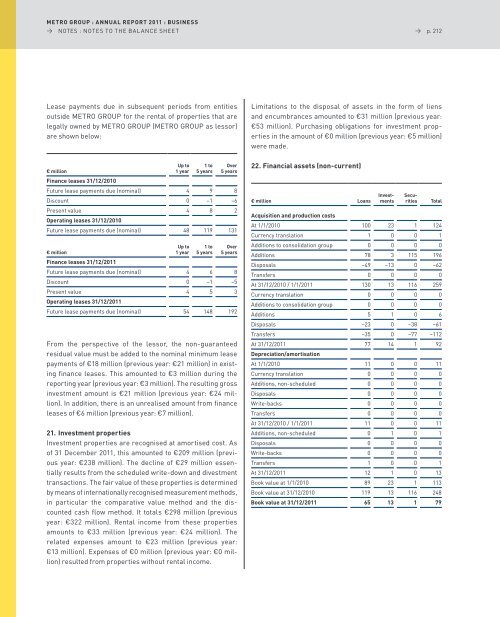
22. Financial assets (non-current)<br />
€ million Loans<br />
investments<br />
securities<br />
Total<br />
Acquisition and production costs<br />
at 1/1/2010 100 23 1 124<br />
Currency translation 1 0 0 1<br />
additions to consolidation group 0 0 0 0<br />
additions 78 3 115 196<br />
Disposals –49 –13 0 –62<br />
Transfers 0 0 0 0<br />
at 31/12/2010 / 1/1/2011 130 13 116 259<br />
Currency translation 0 0 0 0<br />
additions to consolidation group 0 0 0 0<br />
additions 5 1 0 6<br />
Disposals –23 0 –38 –61<br />
Transfers –35 0 –77 –112<br />
at 31/12/2011<br />
Depreciation/amortisation<br />
77 14 1 92<br />
at 1/1/2010 11 0 0 11<br />
Currency translation 0 0 0 0<br />
additions, non-scheduled 0 0 0 0<br />
Disposals 0 0 0 0<br />
Write-backs 0 0 0 0<br />
Transfers 0 0 0 0<br />
at 31/12/2010 / 1/1/2011 11 0 0 11<br />
additions, non-scheduled 0 1 0 1<br />
Disposals 0 0 0 0<br />
Write-backs 0 0 0 0<br />
Transfers 1 0 0 1<br />
at 31/12/2011 12 1 0 13<br />
Book value at 1/1/2010 89 23 1 113<br />
Book value at 31/12/2010 119 13 116 248<br />
Book value at 31/12/2011 65 13 1 79