pdf (22.8 MB) - METRO Group
pdf (22.8 MB) - METRO Group
pdf (22.8 MB) - METRO Group

Create successful ePaper yourself
Turn your PDF publications into a flip-book with our unique Google optimized e-Paper software.
<strong>METRO</strong> GROUP : ANNUAL REPORT 2011 : BUSINESS<br />
→ GROUP MANAGEMENT REPORT : 4. FiNANciAl ANd AssET POsiTiON<br />
€ million Note no. 31/12/2010 31/12/2011<br />
Non-current liabilities<br />
provisions for pensions and<br />
8,990 8,254<br />
other commitments 32 1,016 1,028<br />
other provisions 33 472 478<br />
Financial liabilities 34,36 6,533 5,835<br />
other liabilities 34,37 757 756<br />
Deferred tax liabilities 24 212 157<br />
Current liabilities 19,617 19,296<br />
Trade payables 34,35 14,393 14,267<br />
provisions 33 532 531<br />
Financial liabilities 34,36 1,750 1,606<br />
other liabilities 34,37 2,458 2,498<br />
Income tax liabilities<br />
liabilities connected to assets<br />
34 291 394<br />
held for sale 30 193 0<br />
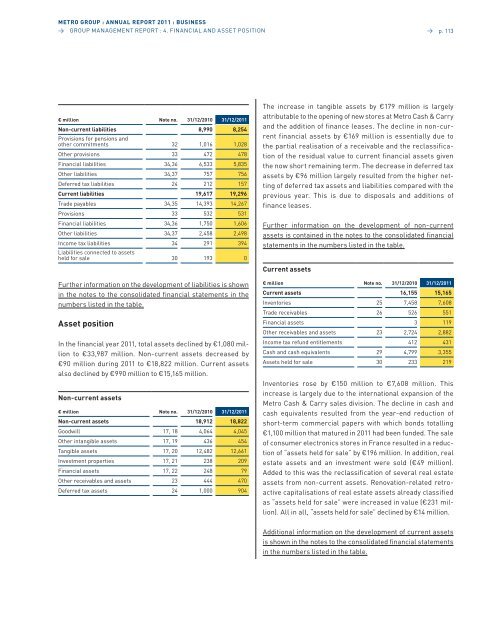
Further information on the development of liabilities is shown<br />
in the notes to the consolidated financial statements in the<br />
numbers listed in the table.<br />
Asset position<br />
In the financial year 2011, total assets declined by €1,080 million<br />
to €33,987 million. non-current assets decreased by<br />
€90 million during 2011 to €18,822 million. Current assets<br />
also declined by €990 million to €15,165 million.<br />
Non-current assets<br />
€ million Note no. 31/12/2010 31/12/2011<br />
Non-current assets 18,912 18,822<br />
Goodwill 17, 18 4,064 4,045<br />
other intangible assets 17, 19 436 454<br />
Tangible assets 17, 20 12,482 12,661<br />
Investment properties 17, 21 238 209<br />
Financial assets 17, 22 248 79<br />
other receivables and assets 23 444 470<br />
Deferred tax assets 24 1,000 904<br />
→ p. 113<br />
The increase in tangible assets by €179 million is largely<br />
attributable to the opening of new stores at Metro Cash & Carry<br />
and the addition of finance leases. The decline in non-current<br />
financial assets by €169 million is essentially due to<br />
the partial realisation of a receivable and the reclassification<br />
of the residual value to current financial assets given<br />
the now short remaining term. The decrease in deferred tax<br />
assets by €96 million largely resulted from the higher netting<br />
of deferred tax assets and liabilities compared with the<br />
previous year. This is due to disposals and additions of<br />
finance leases.<br />
Further information on the development of non-current<br />
assets is contained in the notes to the consolidated financial<br />
statements in the numbers listed in the table.<br />
Current assets<br />
€ million Note no. 31/12/2010 31/12/2011<br />
Current assets 16,155 15,165<br />
Inventories 25 7,458 7,608<br />
Trade receivables 26 526 551<br />
Financial assets 3 119<br />
other receivables and assets 23 2,724 2,882<br />
Income tax refund entitlements 412 431<br />
Cash and cash equivalents 29 4,799 3,355<br />
assets held for sale 30 233 219<br />
Inventories rose by €150 million to €7,608 million. This<br />
increase is largely due to the international expansion of the<br />
Metro Cash & Carry sales division. The decline in cash and<br />
cash equivalents resulted from the year-end reduction of<br />
short-term commercial papers with which bonds totalling<br />
€1,100 million that matured in 2011 had been funded. The sale<br />
of consumer electronics stores in France resulted in a reduction<br />
of “assets held for sale” by €196 million. In addition, real<br />
estate assets and an investment were sold (€49 million).<br />
added to this was the reclassification of several real estate<br />
assets from non-current assets. Renovation-related retroactive<br />
capitalisations of real estate assets already classified<br />
as “assets held for sale” were increased in value (€231 million).<br />
all in all, “assets held for sale” declined by €14 million.<br />
additional information on the development of current assets<br />
is shown in the notes to the consolidated financial statements<br />
in the numbers listed in the table.