pdf (22.8 MB) - METRO Group
pdf (22.8 MB) - METRO Group
pdf (22.8 MB) - METRO Group

You also want an ePaper? Increase the reach of your titles
YUMPU automatically turns print PDFs into web optimized ePapers that Google loves.
<strong>METRO</strong> GROUP : ANNUAL REPORT 2011 : BUSINESS<br />
→ GROUP MANAGEMENT REPORT : 3. EARNiNGs POsiTiON<br />
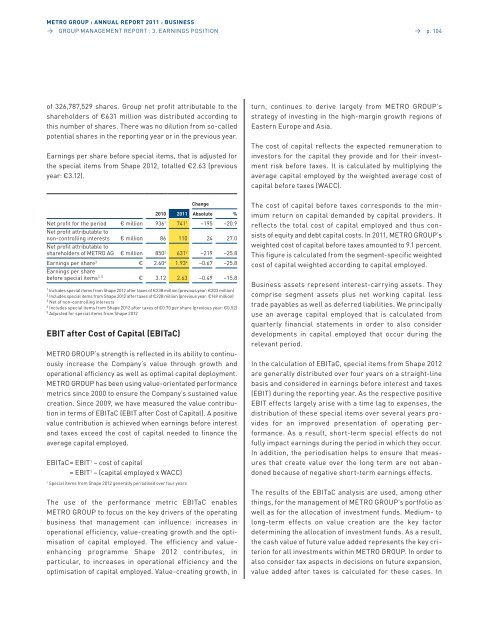
of 326,787,529 shares. <strong>Group</strong> net profit attributable to the<br />
shareholders of €631 million was distributed according to<br />
this number of shares. There was no dilution from so-called<br />
potential shares in the reporting year or in the previous year.<br />
earnings per share before special items, that is adjusted for<br />
the special items from shape 2012, totalled €2.63 (previous<br />
year: €3.12).<br />
EBiT after Cost of Capital (EBiTaC)<br />
MeTRo GRoUp’s strength is reflected in its ability to continuously<br />
increase the Company’s value through growth and<br />
operational efficiency as well as optimal capital deployment.<br />
MeTRo GRoUp has been using value-orientated performance<br />
metrics since 2000 to ensure the Company’s sustained value<br />
creation. since 2009, we have measured the value contribution<br />
in terms of eBITaC (eBIT after Cost of Capital). a positive<br />
value contribution is achieved when earnings before interest<br />
and taxes exceed the cost of capital needed to finance the<br />
average capital employed.<br />
eBITaC = eBIT 1 – cost of capital<br />
= eBIT 1 – (capital employed x WaCC)<br />
1 special items from shape 2012 generally periodised over four years<br />
Change<br />
2010 2011 Absolute %<br />
net profit for the period € million 9361 7411 net profit attributable to<br />
–195 –20.9<br />
non-controlling interests<br />
net profit attributable to<br />
€ million 86 110 24 27.0<br />
shareholders of MeTRo aG € million 8502 6312 –219 –25.8<br />
earnings per share3 € 2.604 1.934 earnings per share<br />
–0.67 –25.8<br />
before special items3, 5 € 3.12 2.63 –0.49 –15.8<br />
1 Includes special items from shape 2012 after taxes of €238 million (previous year: €203 million)<br />
2 Includes special items from shape 2012 after taxes of €228 million (previous year: €169 million)<br />
3 net of non-controlling interests<br />
4 Includes special items from shape 2012 after taxes of €0.70 per share (previous year: €0.52)<br />
5 adjusted for special items from shape 2012<br />
The use of the performance metric eBITaC enables<br />
MeTRo GRoUp to focus on the key drivers of the operating<br />
business that management can influence: increases in<br />
operational efficiency, value-creating growth and the optimisation<br />
of capital employed. The efficiency and valueenhancing<br />
programme shape 2012 contributes, in<br />
particular, to increases in operational efficiency and the<br />
optimisation of capital employed. value-creating growth, in<br />
→ p. 104<br />
turn, continues to derive largely from MeTRo GRoUp’s<br />
strategy of investing in the high-margin growth regions of<br />
eastern europe and asia.<br />
The cost of capital reflects the expected remuneration to<br />
investors for the capital they provide and for their investment<br />
risk before taxes. It is calculated by multiplying the<br />
average capital employed by the weighted average cost of<br />
capital before taxes (WaCC).<br />
The cost of capital before taxes corresponds to the minimum<br />
return on capital demanded by capital providers. It<br />
reflects the total cost of capital employed and thus consists<br />
of equity and debt capital costs. In 2011, MeTRo GRoUp’s<br />
weighted cost of capital before taxes amounted to 9.1 percent.<br />
This figure is calculated from the segment-specific weighted<br />
cost of capital weighted according to capital employed.<br />
Business assets represent interest-carrying assets. They<br />
comprise segment assets plus net working capital less<br />
trade payables as well as deferred liabilities. We principally<br />
use an average capital employed that is calculated from<br />
quarterly financial statements in order to also consider<br />
developments in capital employed that occur during the<br />
relevant period.<br />
In the calculation of eBITaC, special items from shape 2012<br />
are generally distributed over four years on a straight-line<br />
basis and considered in earnings before interest and taxes<br />
(eBIT) during the reporting year. as the respective positive<br />
eBIT effects largely arise with a time lag to expenses, the<br />
distribution of these special items over several years provides<br />
for an improved presentation of operating performance.<br />
as a result, short-term special effects do not<br />
fully impact earnings during the period in which they occur.<br />
In addition, the periodisation helps to ensure that mea sures<br />
that create value over the long term are not abandoned<br />
because of negative short-term earnings effects.<br />
The results of the eBITaC analysis are used, among other<br />
things, for the management of MeTRo GRoUp’s portfolio as<br />
well as for the allocation of investment funds. Medium- to<br />
long-term effects on value creation are the key factor<br />
determining the allocation of investment funds. as a result,<br />
the cash value of future value added represents the key criterion<br />
for all investments within MeTRo GRoUp. In order to<br />
also consider tax aspects in decisions on future expansion,<br />
value added after taxes is calculated for these cases. In