pdf (22.8 MB) - METRO Group
pdf (22.8 MB) - METRO Group
pdf (22.8 MB) - METRO Group

Create successful ePaper yourself
Turn your PDF publications into a flip-book with our unique Google optimized e-Paper software.
<strong>METRO</strong> gROUP : ANNUAL REPORT 2011 : sERViCE<br />
→ MUlTI-YeaR oveRvIeW → p. 298<br />
702<br />
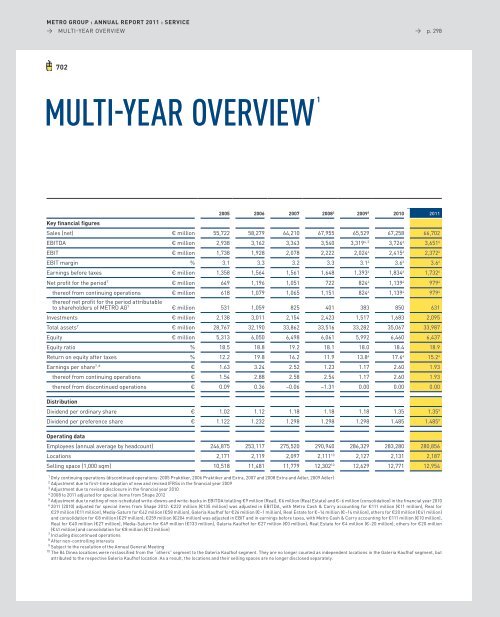
MUlTI-YEAR OVERVIEW 1<br />
2005 2006 2007 2008 2 2009 3 2010 2011<br />
Key financial figures<br />
sales (net) € million 55,722 58,279 64,210 67,955 65,529 67,258 66,702<br />
eBITDa € million 2,938 3,162 3,343 3,540 3,3194, 5 3,7266 3,6516 eBIT € million 1,738 1,928 2,078 2,222 2,0244 2,4156 2,3726 eBIT margin % 3.1 3.3 3.2 3.3 3.14 3.66 3.66 earnings before taxes € million 1,358 1,564 1,561 1,648 1,3934 1,8346 1,7326 net profit for the period7 € million 649 1,196 1,051 722 8244 1,1394 9794 thereof from continuing operations € million 618 1,079 1,065 1,151 8244 1,1394 9794 thereof net profit for the period attributable<br />
to shareholders of MeTRo aG7 € million 531 1,059 825 401 383 850 631<br />
Investments € million 2,138 3,011 2,154 2,423 1,517 1,683 2,095<br />
Total assets7 € million 28,767 32,190 33,862 33,516 33,282 35,067 33,987<br />
equity € million 5,313 6,050 6,498 6,061 5,992 6,460 6,437<br />
equity ratio % 18.5 18.8 19.2 18.1 18.0 18.4 18.9<br />
Return on equity after taxes % 12.2 19.8 16.2 11.9 13.84 17.64 15.24 earnings per share7, 8 € 1.63 3.24 2.52 1.23 1.17 2.60 1.93<br />
thereof from continuing operations € 1.54 2.88 2.58 2.54 1.17 2.60 1.93<br />
thereof from discontinued operations € 0.09 0.36 –0.06 –1.31 0.00 0.00 0.00<br />
Distribution<br />
Dividend per ordinary share € 1.02 1.12 1.18 1.18 1.18 1.35 1.359 Dividend per preference share € 1.122 1.232 1.298 1.298 1.298 1.485 1.4859 Operating data<br />
employees (annual average by headcount) 246,875 253,117 275,520 290,940 286,329 283,280 280,856<br />
locations 2,171 2,119 2,097 2,11110 2,127 2,131 2,187<br />
selling space (1,000 sqm) 10,518 11,481 11,779 12,30210 12,629 12,771 12,954<br />
1 only continuing operations (discontinued operations: 2005 praktiker, 2006 praktiker and extra, 2007 and 2008 extra and adler, 2009 adler)<br />
2 adjustment due to first-time adoption of new and revised IFRss in the financial year 2009<br />
3 adjustment due to revised disclosure in the financial year 2010<br />
4 2008 to 2011 adjusted for special items from shape 2012<br />
5 adjustment due to netting of non-scheduled write-downs and write-backs in eBITDa totalling €9 million (Real), €6 million (Real estate) and €–6 million (consolidation) in the financial year 2010<br />
6 2011 (2010) adjusted for special items from shape 2012: €222 million (€135 million) was adjusted in eBITDa, with Metro Cash & Carry accounting for €111 million (€11 million), Real for<br />
€29 million (€11 million), Media-saturn for €42 million (€58 million), Galeria Kaufhof for €26 million (€–1 million), Real estate for €–14 million (€–14 million), others for €20 million (€41 million)<br />
and consolidation for €8 million (€29 million); €259 million (€204 million) was adjusted in eBIT and in earnings before taxes, with Metro Cash & Carry accounting for €111 million (€10 million),<br />
Real for €40 million (€27 million), Media-saturn for €49 million (€133 million), Galeria Kaufhof for €27 million (€0 million), Real estate for €4 million (€–20 million), others for €20 million<br />
(€41 million) and consolidation for €8 million (€13 million)<br />
7 Including discontinued operations<br />
8 after non-controlling interests<br />
9 subject to the resolution of the annual General Meeting<br />
10 The 84 Dinea locations were reclassified from the “others” segment to the Galeria Kaufhof segment. They are no longer counted as independent locations in the Galeria Kaufhof segment, but<br />
attributed to the respective Galeria Kaufhof location. as a result, the locations and their selling spaces are no longer disclosed separately.