pdf (22.8 MB) - METRO Group
pdf (22.8 MB) - METRO Group
pdf (22.8 MB) - METRO Group

Create successful ePaper yourself
Turn your PDF publications into a flip-book with our unique Google optimized e-Paper software.
<strong>METRO</strong> GROUP : ANNUAL REPORT 2011 : BUSINESS<br />
→ GROUP MANAGEMENT REPORT : 4. FiNANciAl ANd AssET POsiTiON<br />
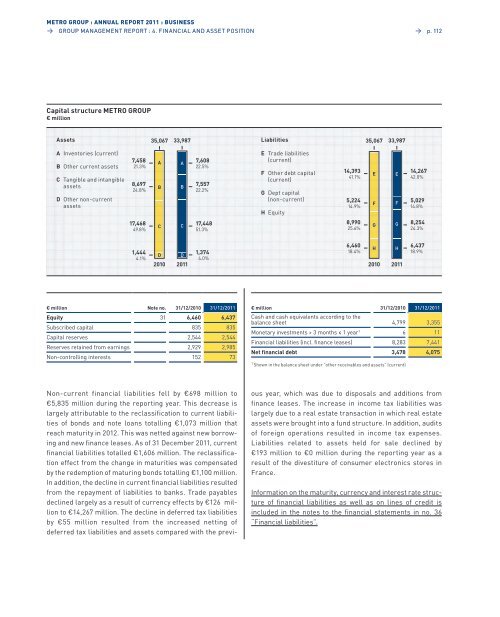
Capital structure <strong>METRO</strong> gROUP<br />
€ million<br />
Assets<br />
A Inventories (current)<br />
B other current assets<br />
C Tangible and intangible<br />
assets<br />
D other non-current<br />
assets<br />
7,458<br />
21.3%<br />
8,697<br />
24.8%<br />
17,468<br />
49.8%<br />
1,444<br />
4.1%<br />
35,067<br />
D<br />
2010<br />
non-current financial liabilities fell by €698 million to<br />
€5,835 million during the reporting year. This decrease is<br />
largely attributable to the reclassification to current liabilities<br />
of bonds and note loans totalling €1,073 million that<br />
reach maturity in 2012. This was netted against new borrowing<br />
and new finance leases. as of 31 December 2011, current<br />
financial liabilities totalled €1,606 million. The reclassification<br />
effect from the change in maturities was compensated<br />
by the redemption of maturing bonds totalling €1,100 million.<br />
In addition, the decline in current financial liabilities resulted<br />
from the repayment of liabilities to banks. Trade payables<br />
declined largely as a result of currency effects by €126 million<br />
to €14,267 million. The decline in deferred tax liabilities<br />
by €55 million resulted from the increased netting of<br />
deferred tax liabilities and assets compared with the previ-<br />
A<br />
B<br />
C<br />
33,987<br />
A<br />
B<br />
C<br />
D<br />
2011<br />
7,608<br />
22.5%<br />
7,557<br />
22.2%<br />
17,448<br />
51.3%<br />
1,374<br />
4.0%<br />
€ million Note no. 31/12/2010 31/12/2011<br />
Equity 31 6,460 6,437<br />
subscribed capital 835 835<br />
Capital reserves 2,544 2,544<br />
Reserves retained from earnings 2,929 2,985<br />
non-controlling interests 152 73<br />
Liabilities<br />
E Trade liabilities<br />
(current)<br />
F other debt capital<br />
(current)<br />
g Dept capital<br />
(non-current)<br />
h equity<br />
14,393<br />
41.1%<br />
5,224<br />
14.9%<br />
8,990<br />
25.6%<br />
6,460<br />
18.4%<br />
35,067<br />
2010<br />
→ p. 112<br />
ous year, which was due to disposals and additions from<br />
finance leases. The increase in income tax liabilities was<br />
largely due to a real estate transaction in which real estate<br />
assets were brought into a fund structure. In addition, audits<br />
of foreign operations resulted in income tax expenses.<br />
liabilities related to assets held for sale declined by<br />
€193 million to €0 million during the reporting year as a<br />
result of the divestiture of consumer electronics stores in<br />
France.<br />
Information on the maturity, currency and interest rate structure<br />
of financial liabilities as well as on lines of credit is<br />
included in the notes to the financial statements in no. 36<br />
“Financial liabilities”.<br />
E<br />
F<br />
G<br />
H<br />
33,987<br />
E<br />
F<br />
G<br />
H<br />
2011<br />
14,267<br />
42.0%<br />
5,029<br />
14.8%<br />
8,254<br />
24.3%<br />
6,437<br />
18.9%<br />
€ million<br />
Cash and cash equivalents according to the<br />
31/12/2010 31/12/2011<br />
balance sheet 4,799 3,355<br />
Monetary investments > 3 months ≤ 1 year1 6 11<br />
Financial liabilities (incl. finance leases) 8,283 7,441<br />
Net financial debt 3,478 4,075<br />
1 shown in the balance sheet under “other receivables and assets” (current)