pdf (22.8 MB) - METRO Group
pdf (22.8 MB) - METRO Group
pdf (22.8 MB) - METRO Group

You also want an ePaper? Increase the reach of your titles
YUMPU automatically turns print PDFs into web optimized ePapers that Google loves.
<strong>METRO</strong> GROUP : ANNUAL REPORT 2011 : BUSINESS<br />
→ GROUP MANAGEMENT REPORT : 3. EARNiNGs POsiTiON<br />
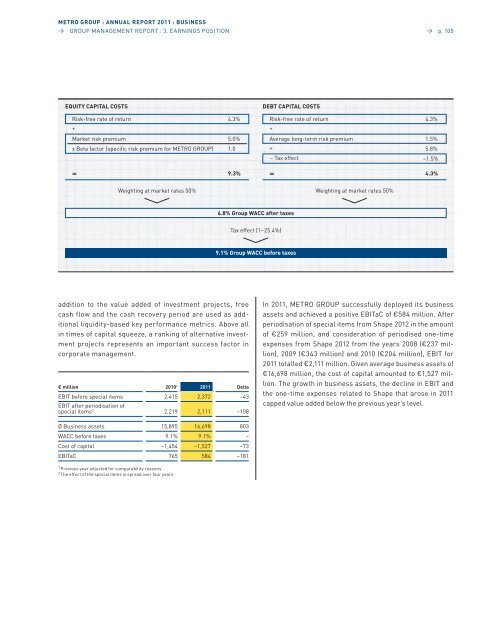
EQUiTy CAPiTAL COsTs<br />
Risk-free rate of return<br />
+<br />
4.3%<br />
Market risk premium 5.0%<br />
x Beta factor (specific risk premium for MeTRo GRoUp) 1.0<br />
= 9.3%<br />
Weighting at market rates 50%<br />
addition to the value added of investment projects, free<br />
cash flow and the cash recovery period are used as additional<br />
liquidity-based key performance metrics. above all<br />
in times of capital squeeze, a ranking of alternative investment<br />
projects represents an important success factor in<br />
corporate management.<br />
€ million 20101 2011 Delta<br />
eBIT before special items 2,415 2,372 –43<br />
eBIT after periodisation of<br />
special items2 2,219 2,111 –108<br />
Ø Business assets 15,895 16,698 803<br />
WaCC before taxes 9.1% 9.1% –<br />
Cost of capital –1,454 –1,527 –73<br />
eBITaC 765 584 –181<br />
1 previous year adjusted for comparability reasons<br />
2 The effect of the special items is spread over four years<br />
DEBT CAPiTAL COsTs<br />
6.8% group wACC after taxes<br />
Tax effect (1–25.4%)<br />
9.1% group wACC before taxes<br />
Risk-free rate of return 4.3%<br />
+<br />
average long-term risk premium 1.5%<br />
= 5.8%<br />
– Tax effect –1.5%<br />
= 4.3%<br />
Weighting at market rates 50%<br />
→ p. 105<br />
In 2011, MeTRo GRoUp successfully deployed its business<br />
assets and achieved a positive eBITaC of €584 million. after<br />
periodisation of special items from shape 2012 in the amount<br />
of €259 million, and consideration of periodised one-time<br />
expenses from shape 2012 from the years 2008 (€237 million),<br />
2009 (€343 million) and 2010 (€204 million), eBIT for<br />
2011 totalled €2,111 million. Given average business assets of<br />
€16,698 million, the cost of capital amounted to €1,527 million.<br />
The growth in business assets, the decline in eBIT and<br />
the one-time expenses related to shape that arose in 2011<br />
capped value added below the previous year’s level.