pdf (22.8 MB) - METRO Group
pdf (22.8 MB) - METRO Group
pdf (22.8 MB) - METRO Group

You also want an ePaper? Increase the reach of your titles
YUMPU automatically turns print PDFs into web optimized ePapers that Google loves.
<strong>METRO</strong> gROUP : ANNUAL REPORT 2011 : BUsiNEss<br />
→ noTes : seGMenT RepoRTInG<br />
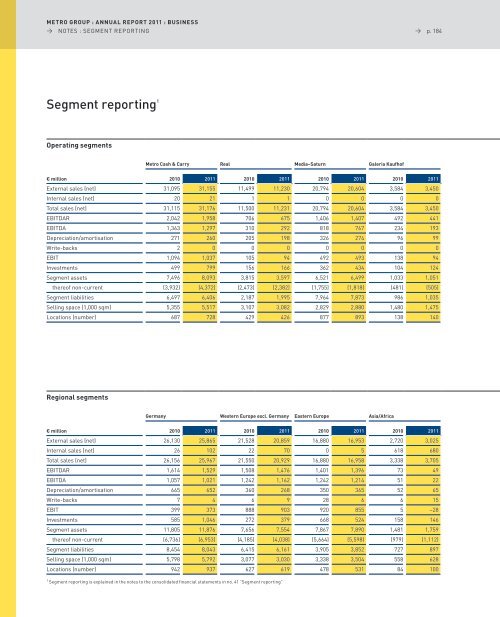
Segment reporting 1<br />
Operating segments<br />
Metro Cash & Carry Real Media–saturn galeria Kaufhof<br />
→ p. 184<br />
€ million 2010 2011 2010 2011 2010 2011 2010 2011<br />
external sales (net) 31,095 31,155 11,499 11,230 20,794 20,604 3,584 3,450<br />
Internal sales (net) 20 21 1 1 0 0 0 0<br />
Total sales (net) 31,115 31,176 11,500 11,231 20,794 20,604 3,584 3,450<br />
eBITDaR 2,042 1,958 706 675 1,406 1,407 492 441<br />
eBITDa 1,363 1,297 310 292 818 767 234 193<br />
Depreciation/amortisation 271 260 205 198 326 274 96 99<br />
Write-backs 2 0 0 0 0 0 0 0<br />
eBIT 1,094 1,037 105 94 492 493 138 94<br />
Investments 499 799 156 166 362 434 104 124<br />
segment assets 7,496 8,093 3,815 3,597 6,521 6,499 1,033 1,051<br />
thereof non-current (3,932) (4,372) (2,473) (2,382) (1,755) (1,818) (481) (505)<br />
segment liabilities 6,497 6,406 2,187 1,995 7,964 7,873 986 1,035<br />
selling space (1,000 sqm) 5,355 5,517 3,107 3,082 2,829 2,880 1,480 1,475<br />
locations (number) 687 728 429 426 877 893 138 140<br />
Regional segments<br />
germany western Europe excl. germany Eastern Europe Asia/Africa<br />
€ million 2010 2011 2010 2011 2010 2011 2010 2011<br />
external sales (net) 26,130 25,865 21,528 20,859 16,880 16,953 2,720 3,025<br />
Internal sales (net) 26 102 22 70 0 5 618 680<br />
Total sales (net) 26,156 25,967 21,550 20,929 16,880 16,958 3,338 3,705<br />
eBITDaR 1,614 1,529 1,508 1,476 1,401 1,396 73 49<br />
eBITDa 1,057 1,021 1,242 1,162 1,242 1,214 51 22<br />
Depreciation/amortisation 665 652 360 268 350 365 52 65<br />
Write-backs 7 4 6 9 28 6 6 15<br />
eBIT 399 373 888 903 920 855 5 –28<br />
Investments 585 1,046 272 379 668 524 158 146<br />
segment assets 11,805 11,876 7,656 7,554 7,867 7,890 1,481 1,759<br />
thereof non-current (6,736) (6,953) (4,185) (4,038) (5,664) (5,598) (979) (1,112)<br />
segment liabilities 8,454 8,043 6,415 6,161 3,905 3,852 727 897<br />
selling space (1,000 sqm) 5,798 5,792 3,077 3,030 3,338 3,504 558 628<br />
locations (number) 942 937 627 619 478 531 84 100<br />
1 segment reporting is explained in the notes to the consolidated financial statements in no. 41 “segment reporting”