pdf (22.8 MB) - METRO Group
pdf (22.8 MB) - METRO Group
pdf (22.8 MB) - METRO Group

You also want an ePaper? Increase the reach of your titles
YUMPU automatically turns print PDFs into web optimized ePapers that Google loves.
<strong>METRO</strong> gROUP : ANNUAL REPORT 2011 : BUsiNEss<br />
→ noTes : noTes To THe InCoMe sTaTeMenT<br />
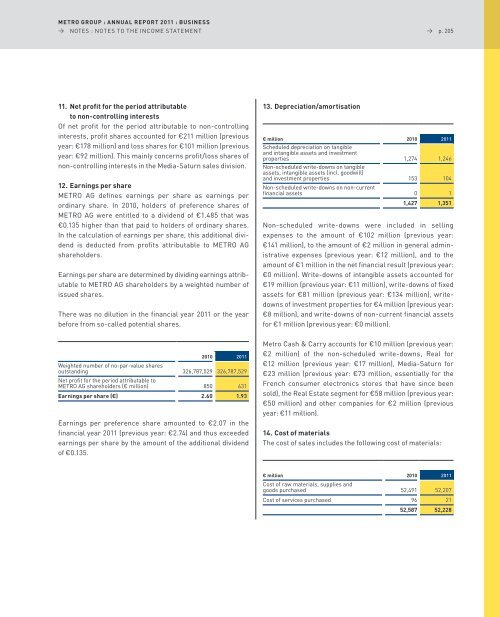
11. Net profit for the period attributable<br />
to non-controlling interests<br />
of net profit for the period attributable to non-controlling<br />
interests, profit shares accounted for €211 million (previous<br />
year: €178 million) and loss shares for €101 million (previous<br />
year: €92 million). This mainly concerns profit/loss shares of<br />
non-controlling interests in the Media-saturn sales division.<br />
12. Earnings per share<br />
MeTRo aG defines earnings per share as earnings per<br />
ordinary share. In 2010, holders of preference shares of<br />
MeTRo aG were entitled to a dividend of €1.485 that was<br />
€0.135 higher than that paid to holders of ordinary shares.<br />
In the calculation of earnings per share, this additional dividend<br />
is deducted from profits attributable to MeTRo aG<br />
shareholders.<br />
earnings per share are determined by dividing earnings attributable<br />
to MeTRo aG shareholders by a weighted number of<br />
issued shares.<br />
There was no dilution in the financial year 2011 or the year<br />
before from so-called potential shares.<br />
2010 2011<br />
Weighted number of no-par-value shares<br />
outstanding<br />
net profit for the period attributable to<br />
326,787,529 326,787,529<br />
MeTRo aG shareholders (€ million) 850 631<br />
Earnings per share (€) 2.60 1.93<br />
earnings per preference share amounted to €2.07 in the<br />
financial year 2011 (previous year: €2.74) and thus exceeded<br />
earnings per share by the amount of the additional dividend<br />
of €0.135.<br />
13. Depreciation/amortisation<br />
→ p. 205<br />
€ million<br />
scheduled depreciation on tangible<br />
and intangible assets and investment<br />
2010 2011<br />
properties<br />
non-scheduled write-downs on tangible<br />
assets, intangible assets (incl. goodwill)<br />
1,274 1,246<br />
and investment properties<br />
non-scheduled write-downs on non-current<br />
153 104<br />
financial assets 0 1<br />
1,427 1,351<br />
non-scheduled write-downs were included in selling<br />
expenses to the amount of €102 million (previous year:<br />
€141 million), to the amount of €2 million in general administrative<br />
expenses (previous year: €12 million), and to the<br />
amount of €1 million in the net financial result (previous year:<br />
€0 million). Write-downs of intangible assets accounted for<br />
€19 million (previous year: €11 million), write-downs of fixed<br />
assets for €81 million (previous year: €134 million), writedowns<br />
of investment properties for €4 million (previous year:<br />
€8 million), and write-downs of non-current financial assets<br />
for €1 million (previous year: €0 million).<br />
Metro Cash & Carry accounts for €10 million (previous year:<br />
€2 million) of the non-scheduled write-downs, Real for<br />
€12 million (previous year: €17 million), Media-saturn for<br />
€23 million (previous year: €73 million, essentially for the<br />
French consumer electronics stores that have since been<br />
sold), the Real estate segment for €58 million (previous year:<br />
€50 million) and other companies for €2 million (previous<br />
year: €11 million).<br />
14. Cost of materials<br />
The cost of sales includes the following cost of materials:<br />
€ million<br />
Cost of raw materials, supplies and<br />
2010 2011<br />
goods purchased 52,491 52,207<br />
Cost of services purchased 96 21<br />
52,587 52,228