informe preliminar - Ministerio de Transportes y Comunicaciones
informe preliminar - Ministerio de Transportes y Comunicaciones
informe preliminar - Ministerio de Transportes y Comunicaciones

Create successful ePaper yourself
Turn your PDF publications into a flip-book with our unique Google optimized e-Paper software.
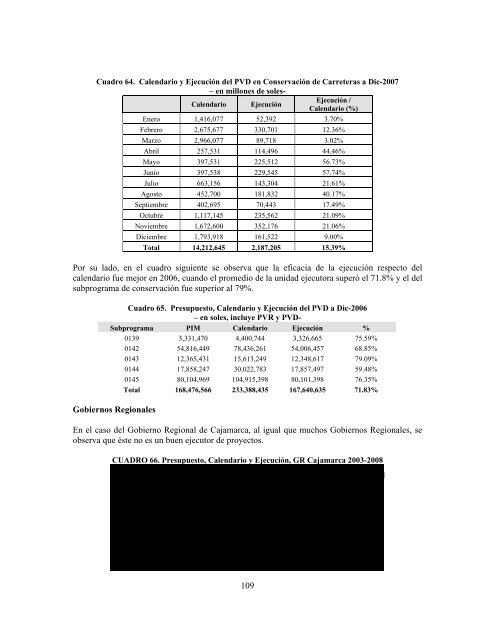
Cuadro 64. Calendario y Ejecución <strong>de</strong>l PVD en Conservación <strong>de</strong> Carreteras a Dic-2007<br />
– en millones <strong>de</strong> soles-<br />
Calendario Ejecución<br />
Ejecución /<br />
Calendario (%)<br />
Enero 1,416,077 52,392 3.70%<br />
Febrero 2,675,677 330,701 12.36%<br />
Marzo 2,966,077 89,718 3.02%<br />
Abril 257,531 114,496 44.46%<br />
Mayo 397,531 225,512 56.73%<br />
Junio 397,538 229,545 57.74%<br />
Julio 663,156 143,304 21.61%<br />
Agosto 452,700 181,832 40.17%<br />
Septiembre 402,695 70,443 17.49%<br />
Octubre 1,117,145 235,562 21.09%<br />
Noviembre 1,672,600 352,176 21.06%<br />
Diciembre 1,793,918 161,522 9.00%<br />
Total 14,212,645 2,187,205 15.39%<br />
Por su lado, en el cuadro siguiente se observa que la eficacia <strong>de</strong> la ejecución respecto <strong>de</strong>l<br />
calendario fue mejor en 2006, cuando el promedio <strong>de</strong> la unidad ejecutora superó el 71.8% y el <strong>de</strong>l<br />
subprograma <strong>de</strong> conservación fue superior al 79%.<br />
Cuadro 65. Presupuesto, Calendario y Ejecución <strong>de</strong>l PVD a Dic-2006<br />
– en soles, incluye PVR y PVD-<br />
Subprograma PIM Calendario Ejecución %<br />
0139 3,331,470 4,400,744 3,326,665 75.59%<br />
0142 54,816,449 78,436,261 54,006,457 68.85%<br />
0143 12,365,431 15,613,249 12,348,617 79.09%<br />
0144 17,858,247 30,022,783 17,857,497 59.48%<br />
0145 80,104,969 104,915,398 80,101,398 76.35%<br />
Total 168,476,566 233,388,435 167,640,635 71.83%<br />
Gobiernos Regionales<br />
En el caso <strong>de</strong>l Gobierno Regional <strong>de</strong> Cajamarca, al igual que muchos Gobiernos Regionales, se<br />
observa que éste no es un buen ejecutor <strong>de</strong> proyectos.<br />
CUADRO 66. Presupuesto, Calendario y Ejecución, GR Cajamarca 2003-2008<br />
Presupuesto Inversión Total<br />
PPTO 2003 2004 2005 2006 2007 2008<br />
PIA 130,667,266 29,729,259 67,178,468 68,746,362 86,385,884 88,336,656<br />
PIM 139,403,734 56,258,593 131,347,046 211,603,824 263,407,071 239,097,928<br />
Ejec 9,678,879 40,032,374 52,663,397 120,284,320 92,572,548<br />
Dif 129,724,855 16,226,219 78,683,649 91,319,504 170,834,523<br />
% 7% 71% 40% 57% 35%<br />
Presupuesto <strong>de</strong> Inversión Se<strong>de</strong> Central<br />
PPTO 2003 2004 2005 2006 2007 2008<br />
PIA 129,017,568 19,659,691 42,784,717 68,746,362 54,462,414 59,927,708<br />
PIM 129,017,568 38,312,219 105,688,932 211,603,824 215,109,156 213,200,366<br />
Ejec 5,659,525 22,671,511 27,415,396 120,284,320 57,158,709<br />
Dif 123,358,043 15,640,708 78,273,536 91,319,504 157,950,447<br />
% 4% 59% 26% 57% 27%<br />
109