PLAN DE ACCIÓN PARA LA ENERGÍA SOSTENIBLE del Municipio ...
PLAN DE ACCIÓN PARA LA ENERGÍA SOSTENIBLE del Municipio ...
PLAN DE ACCIÓN PARA LA ENERGÍA SOSTENIBLE del Municipio ...

You also want an ePaper? Increase the reach of your titles
YUMPU automatically turns print PDFs into web optimized ePapers that Google loves.
Plan de Acción para la Energía Sostenible Documento I. Plan de Acción para la Energía Sostenible<br />
<strong>Municipio</strong> de Ascó 3. Evaluación de las emisiones de GEI en CO2eq<br />
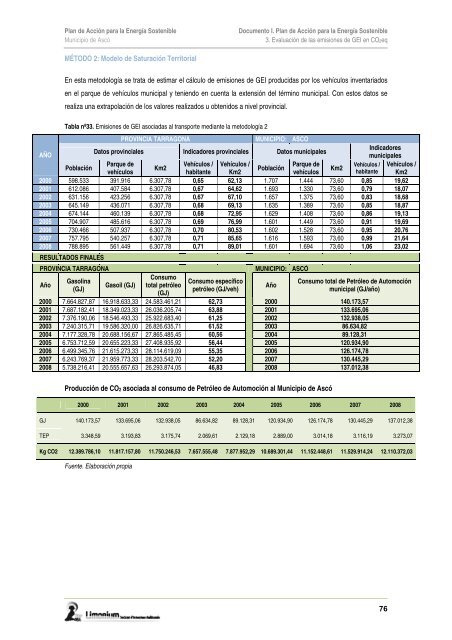
MÉTODO 2: Mo<strong>del</strong>o de Saturación Territorial<br />
En esta metodología se trata de estimar el cálculo de emisiones de GEI producidas por los vehículos inventariados<br />
en el parque de vehículos municipal y teniendo en cuenta la extensión <strong>del</strong> término municipal. Con estos datos se<br />
realiza una extrapolación de los valores realizados u obtenidos a nivel provincial.<br />
Tabla nº33. Emisiones de GEI asociadas al transporte mediante la metodología 2<br />
PROVINCIA TARRAGONA MUNICIPIO: ASCÓ<br />
AÑO<br />
Datos provinciales Indicadores provinciales Datos municipales<br />
Indicadores<br />
municipales<br />
Población<br />
Parque de<br />
vehículos<br />
Km2<br />
Vehículos /<br />
habitante<br />
Vehículos /<br />
Km2<br />
Población<br />
Parque de<br />
vehículos<br />
Km2<br />
Vehículos /<br />
habitante<br />
Vehículos /<br />
Km2<br />
2000 598.533 391.916 6.307,78 0,65 62,13 1.707 1.444 73,60 0,85 19,62<br />
2001 612.086 407.584 6.307,78 0,67 64,62 1.693 1.330 73,60 0,79 18,07<br />
2002 631.156 423.256 6.307,78 0,67 67,10 1.657 1.375 73,60 0,83 18,68<br />
2003 645.149 436.071 6.307,78 0,68 69,13 1.635 1.389 73,60 0,85 18,87<br />
2004 674.144 460.139 6.307,78 0,68 72,95 1.629 1.408 73,60 0,86 19,13<br />
2005 704.907 485.616 6.307,78 0,69 76,99 1.601 1.449 73,60 0,91 19,69<br />
2006 730.466 507.937 6.307,78 0,70 80,53 1.602 1.528 73,60 0,95 20,76<br />
2007 757.795 540.257 6.307,78 0,71 85,65 1.616 1.593 73,60 0,99 21,64<br />
2008 788.895 561.449 6.307,78 0,71 89,01 1.601 1.694 73,60 1,06 23,02<br />
RESULTADOS FINALES<br />
PROVINCIA TARRAGONA MUNICIPIO: ASCÓ<br />
Año<br />
Gasolina<br />
(GJ)<br />
Gasoil (GJ)<br />
Consumo<br />
total petróleo<br />
(GJ)<br />
Consumo específico<br />
petróleo (GJ/veh)<br />
Año<br />
Consumo total de Petróleo de Automoción<br />
municipal (GJ/año)<br />
2000 7.664.827,87 16.918.633,33 24.583.461,21 62,73 2000 140.173,57<br />
2001 7.687.182,41 18.349.023,33 26.036.205,74 63,88 2001 133.695,06<br />
2002 7.376.190,06 18.546.493,33 25.922.683,40 61,25 2002 132.938,05<br />
2003 7.240.315,71 19.586.320,00 26.826.635,71 61,52 2003 86.634,82<br />
2004 7.177.328,78 20.688.156,67 27.865.485,45 60,56 2004 89.128,31<br />
2005 6.753.712,59 20.655.223,33 27.408.935,92 56,44 2005 120.934,90<br />
2006 6.499.345,76 21.615.273,33 28.114.619,09 55,35 2006 126.174,78<br />
2007 6.243.769,37 21.959.773,33 28.203.542,70 52,20 2007 130.445,29<br />
2008 5.738.216,41 20.555.657,63 26.293.874,05 46,83 2008 137.012,38<br />
Producción de CO2 asociada al consumo de Petróleo de Automoción al <strong>Municipio</strong> de Ascó<br />
2000 2001 2002 2003 2004 2005 2006 2007 2008<br />
GJ 140.173,57 133.695,06 132.938,05 86.634,82 89.128,31 120.934,90 126.174,78 130.445,29 137.012,38<br />
TEP 3.348,59 3.193,83 3.175,74 2.069,61 2.129,18 2.889,00 3.014,18 3.116,19 3.273,07<br />
Kg CO2 12.389.786,10 11.817.157,80 11.750.246,53 7.657.555,48 7.877.952,29 10.689.301,44 11.152.448,61 11.529.914,24 12.110.372,03<br />
Fuente. Elaboración propia<br />
76