- Page 2:
MASTERING Digital Printing Second E
- Page 6:
All trademarks are the property of
- Page 10:
Foreword In early 1989, I was facin
- Page 14:
About the Author Harald Johnson has
- Page 18:
2 3 4 Understanding Digital Printin
- Page 22:
7 8 8. What About Printer Software,
- Page 26:
PART III : BEYOND THE BASICS 10 11
- Page 30:
Whom This Book Is For Written for p
- Page 34:
This page intentionally left blank
- Page 42:
1 Navigating the Digital Landscape
- Page 46:
manager, would always hit the local
- Page 50:
Wehrenberg was already familiar wit
- Page 54:
Chapter 1 ■ Navigating the Digita
- Page 58:
Computers, Art, and Printmaking: A
- Page 62:
element, the basic unit of image in
- Page 66:
Photographic Prints Photographers h
- Page 70:
Liquid emulsions, image transfers,
- Page 74:
Printing Cousins: Offset and Digita
- Page 78:
Larger Sizes Size is not much of an
- Page 82:
Some of the photographers who are e
- Page 86:
New Mexico artist Ursula Freer has
- Page 90:
Schools are also promoting digital
- Page 94:
Disadvantages of Self-Printing ■
- Page 98:
Print Council of America’s defini
- Page 102:
One problem, of course, is that whe
- Page 106:
This page intentionally left blank
- Page 112:
38 Mastering Digital Printing That
- Page 116:
40 Mastering Digital Printing Digit
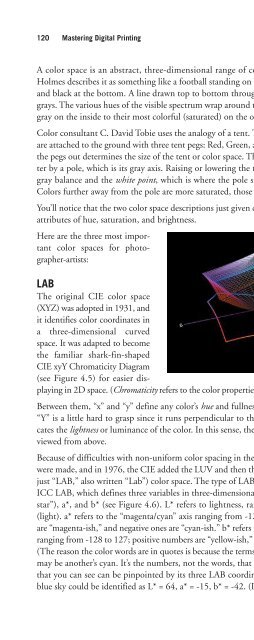
- Page 120:
42 Mastering Digital Printing Howev
- Page 124:
44 Mastering Digital Printing (For
- Page 128:
46 Mastering Digital Printing 1/288
- Page 132:
48 Mastering Digital Printing Since
- Page 136:
50 Mastering Digital Printing Viewi
- Page 140:
52 Mastering Digital Printing Table
- Page 144:
54 Mastering Digital Printing At th
- Page 148:
56 Mastering Digital Printing This
- Page 152:
58 Mastering Digital Printing Figur
- Page 156:
60 Mastering Digital Printing just
- Page 160:
62 Mastering Digital Printing The O
- Page 164:
64 Mastering Digital Printing Examp
- Page 168:
66 Mastering Digital Printing dry,
- Page 172:
68 Mastering Digital Printing yello
- Page 176:
70 Mastering Digital Printing Therm
- Page 180:
72 Mastering Digital Printing Piezo
- Page 186:
3 Creating and Processing the Image
- Page 190:
(Most modern scanners are 12-bit sc
- Page 194:
the bed of the scanner. They don’
- Page 198:
want to scale the image’s printed
- Page 202:
Testing Scanner Resolutions for Pri
- Page 206:
Sending Out for Scans Chapter 3 ■
- Page 210:
did when viewing the film on the li
- Page 214:
Several manufacturers such as Micro
- Page 218:
“The Creo EverSmart scanner has b
- Page 222:
people, and now that we’re at the
- Page 226: and decompressed file at 300 ppi wo
- Page 230: BetterLight Scan Backs One way to g
- Page 234: As with other painting programs, St
- Page 238: Image Editing Once you have the raw
- Page 242: From a high-quality, digital printi
- Page 246: Qimage Qimage fills it own unique c
- Page 250: image in Chapter 8. However, this i
- Page 254: with all the layers and adjustments
- Page 258: JPEG2000 supposedly has the highest
- Page 262: Canto Cumulus differs from Extensis
- Page 268: 116 Mastering Digital Printing When
- Page 272: 118 Mastering Digital Printing Figu
- Page 278: color geeky, you’ll want to explo
- Page 282: ColorMatch RGB Originally designed
- Page 286: 2. If you’re using a print-servic
- Page 290: Welcome to ICC Color Management In
- Page 294: What Is Your Intent? Monitor profil
- Page 298: Hardware-based profile-generating p
- Page 302: it is not. In the context of color
- Page 306: Here’s what happens behind the sc
- Page 310: Chapter 4 ■ Understanding and Man
- Page 314: Custom, remote profiles can be purc
- Page 318: 1. Open and Convert A color-managed
- Page 322: ■ The validity and quality of thi
- Page 328:
146 Mastering Digital Printing Digi
- Page 332:
148 Mastering Digital Printing The
- Page 336:
150 Mastering Digital Printing What
- Page 340:
152 Mastering Digital Printing Cata
- Page 344:
154 Mastering Digital Printing What
- Page 348:
156 Mastering Digital Printing Visu
- Page 352:
158 Mastering Digital Printing The
- Page 356:
160 Mastering Digital Printing Acce
- Page 360:
162 Mastering Digital Printing Sinc
- Page 364:
164 Mastering Digital Printing extr
- Page 368:
166 Mastering Digital Printing Tabl
- Page 372:
168 Mastering Digital Printing Tabl
- Page 376:
170 Mastering Digital Printing Koda
- Page 380:
172 Mastering Digital Printing Stud
- Page 384:
174 Mastering Digital Printing Reme
- Page 388:
176 Mastering Digital Printing Coat
- Page 394:
Part II The Main Event: Inkjet Prin
- Page 400:
182 Mastering Digital Printing Tabl
- Page 404:
184 Mastering Digital Printing What
- Page 408:
186 Mastering Digital Printing 2. H
- Page 412:
188 Mastering Digital Printing Six,
- Page 416:
190 Mastering Digital Printing For
- Page 420:
192 Mastering Digital Printing The
- Page 424:
194 Mastering Digital Printing Base
- Page 428:
196 Mastering Digital Printing Most
- Page 432:
198 Mastering Digital Printing For
- Page 436:
200 Mastering Digital Printing Conn
- Page 440:
202 Mastering Digital Printing Simi
- Page 444:
204 Mastering Digital Printing 9. W
- Page 448:
206 Mastering Digital Printing Wide
- Page 452:
208 Mastering Digital Printing OEM
- Page 456:
210 Mastering Digital Printing Mima
- Page 462:
7 Choosing Your Consumables Anyone
- Page 466:
The reason I say “in most cases
- Page 470:
the inks tend to get lost in the pa
- Page 474:
Warning: Putting third-party inks i
- Page 478:
You can also buy virgin, empty cart
- Page 482:
MediaStreet Niagara II and III Cont
- Page 486:
Bulk Ink for Wide-Format Third-Part
- Page 490:
seemingly identical ink cartridges
- Page 494:
What sets uncoated fine-art papers
- Page 498:
There are so many coated inkjet pap
- Page 502:
Deciding on Paper Choosing among al
- Page 506:
Chapter 7 ■ Choosing Your Consuma
- Page 510:
Color: The whiter the substrate, th
- Page 514:
Brightness: Brightness is usually g
- Page 518:
Cost: I’ve already described ink
- Page 522:
Exotic Papers: There are lots of sp
- Page 526:
major manufacturer/distributor webs
- Page 530:
This page intentionally left blank
- Page 536:
250 Mastering Digital Printing Phot
- Page 540:
252 Mastering Digital Printing Conn
- Page 544:
254 Mastering Digital Printing Besi
- Page 548:
256 Mastering Digital Printing RIPs
- Page 552:
258 Mastering Digital Printing Step
- Page 556:
260 Mastering Digital Printing Maki
- Page 560:
262 Mastering Digital Printing A mo
- Page 564:
264 Mastering Digital Printing Step
- Page 568:
266 Mastering Digital Printing give
- Page 572:
268 Mastering Digital Printing The
- Page 576:
270 Mastering Digital Printing Medi
- Page 580:
272 Mastering Digital Printing Step
- Page 584:
274 Mastering Digital Printing to p
- Page 588:
276 Mastering Digital Printing A We
- Page 594:
9 Finishing and Displaying Your Pri
- Page 598:
Gas Ghosting In 2003, photographers
- Page 602:
Signing and Numbering If you’re p
- Page 606:
Coating Prints The decision of whet
- Page 610:
Other reasons to coat prints includ
- Page 614:
Table 9.1 Sample Liquid/Spray Coati
- Page 618:
into the tray and then pass your pr
- Page 622:
Mounting and Framing Prints Mountin
- Page 626:
Mats: If loose or hanging edges are
- Page 630:
Another problem for photographers i
- Page 634:
specific place (Paris, Hong Kong, M
- Page 638:
Storing and Shipping Prints After p
- Page 642:
the print had turned a bright yello
- Page 646:
Display Permanence We covered print
- Page 650:
The print finishing points made abo
- Page 658:
10 Using a Print Service There are
- Page 662:
A seasoned printing professional ha
- Page 666:
Size and Practicality If you need l
- Page 670:
Experience? How long have they been
- Page 674:
providing a digital file. If it’s
- Page 678:
Basic Print Cost: Digital printmake
- Page 682:
As you can imagine, this is a very
- Page 686:
Disagreeing with me on this is digi
- Page 690:
“To keep the cost per print to a
- Page 694:
Step 7: Shipping and Storing The jo
- Page 698:
Johnson explains that “while the
- Page 702:
D-Lab, LightJet, Lambda, and Chromi
- Page 706:
Pictage offers a similar service fo
- Page 712:
338 Mastering Digital Printing ■
- Page 716:
340 Mastering Digital Printing What
- Page 720:
342 Mastering Digital Printing Gimp
- Page 724:
344 Mastering Digital Printing Appl
- Page 728:
346 Mastering Digital Printing Chea
- Page 732:
348 Mastering Digital Printing Look
- Page 736:
350 Mastering Digital Printing and
- Page 740:
352 Mastering Digital Printing same
- Page 744:
354 Mastering Digital Printing RGB
- Page 748:
356 Mastering Digital Printing Usin
- Page 752:
358 Mastering Digital Printing Beyo
- Page 756:
360 Mastering Digital Printing Cust
- Page 760:
362 Mastering Digital Printing Bind
- Page 764:
364 Mastering Digital Printing Digi
- Page 768:
366 Mastering Digital Printing Clea
- Page 772:
368 Mastering Digital Printing The
- Page 776:
370 Mastering Digital Printing Fabr
- Page 780:
372 Mastering Digital Printing Digi
- Page 786:
Appendix
- Page 790:
Courtesy of Bogdanoff Gallery/www.b
- Page 794:
This page intentionally left blank
- Page 798:
Blackwell, Benjamin, 97 Blue Wool L
- Page 802:
Creo EverSmart scanner, 91 Creo iQs
- Page 806:
dye sublimation printers, 43, 58-59
- Page 810:
Gottsegen, Mark, 161, 174, 287 Gova
- Page 814:
OEM, 218-227 pigment-based inks, 18
- Page 818:
dumb (non-calibrator), 130 gamma, 1
- Page 822:
ppi-to-lpi ratio, 41 PPPI (pixels p
- Page 826:
prints, 14. See also digital prints
- Page 830:
Staples Fine Art, 33, 322 Stein, Ba