- Page 1:
United States Department of Agricul
- Page 4 and 5:
ii National Cooperative Soil Survey
- Page 6 and 7:
CkE—Cataska channery silt loam, 5
- Page 8 and 9:
WnB—Waynesboro sandy loam, 2 to 6
- Page 10 and 11:
Prime Farmland and Other Important
- Page 13 and 14:
Soil Survey of Murray and Whitfield
- Page 15 and 16:
Murray and Whitfield Counties, Geor
- Page 17 and 18:
Murray and Whitfield Counties, Geor
- Page 19 and 20:
Murray and Whitfield Counties, Geor
- Page 21 and 22:
Murray and Whitfield Counties, Geor
- Page 23 and 24:
General Soil Map Units The general
- Page 25 and 26:
Murray and Whitfield Counties, Geor
- Page 27 and 28:
Murray and Whitfield Counties, Geor
- Page 29 and 30:
Murray and Whitfield Counties, Geor
- Page 31 and 32:
Murray and Whitfield Counties, Geor
- Page 33:
Murray and Whitfield Counties, Geor
- Page 36 and 37:
24 Soil Survey Soils that have prof
- Page 38 and 39:
26 Soil Survey Available water capa
- Page 40 and 41:
28 Soil Survey Available water capa
- Page 42 and 43:
30 Soil Survey 14 to 51 inches—re
- Page 44 and 45:
32 Soil Survey Subsoil: 13 to 18 in
- Page 46 and 47:
34 Soil Survey BoE—Bodine very gr
- Page 48 and 49:
36 Soil Survey Recreational develop
- Page 50 and 51:
38 Soil Survey Woodland Potential p
- Page 52 and 53:
40 Soil Survey Suitability to pastu
- Page 54 and 55:
42 Soil Survey Use and Management L
- Page 56 and 57:
44 Soil Survey 32 to 54 inches—da
- Page 58 and 59:
46 Soil Survey Management concerns:
- Page 60 and 61:
48 Soil Survey Available water capa
- Page 62 and 63:
50 Soil Survey 20 to 28 inches—ye
- Page 64 and 65:
52 Soil Survey Land capability clas
- Page 66 and 67:
54 Soil Survey Urban development Su
- Page 68 and 69:
56 Soil Survey Woodland Potential p
- Page 70 and 71:
58 Soil Survey EdF—Edneytown loam
- Page 72 and 73:
60 Soil Survey Management concerns:
- Page 74 and 75:
62 Soil Survey Capshaw, Conasauga,
- Page 76 and 77:
64 Soil Survey Soil Properties and
- Page 78 and 79:
66 Soil Survey Subsoil: 3 to 6 inch
- Page 80 and 81:
68 Soil Survey Flooding: None Slope
- Page 82 and 83:
70 Soil Survey HcB—Hanceville loa
- Page 84 and 85:
72 Soil Survey HcE—Hanceville loa
- Page 86 and 87:
74 Soil Survey HrF—Hector-Townley
- Page 88 and 89:
76 Soil Survey Minor Components Alb
- Page 90 and 91:
78 Soil Survey Available water capa
- Page 92 and 93:
80 Soil Survey Soil Properties and
- Page 94 and 95:
82 Soil Survey Underlying material:
- Page 96 and 97:
84 Soil Survey Land capability clas
- Page 98 and 99:
86 Soil Survey Suitability to hay:
- Page 100 and 101:
88 Soil Survey Urban land Urban lan
- Page 102 and 103:
90 Soil Survey Typical Profile Mont
- Page 104 and 105:
92 Soil Survey Soils that have bedr
- Page 106 and 107:
94 Soil Survey Permeability: Modera
- Page 108 and 109:
96 Soil Survey Subsurface layer: 5
- Page 110 and 111:
98 Soil Survey NeE—Nella gravelly
- Page 112 and 113:
100 Soil Survey Woodland Potential
- Page 114 and 115:
102 Soil Survey PaE—Panama very g
- Page 116 and 117:
104 Soil Survey Recreational develo
- Page 118 and 119:
106 Soil Survey SaA—Sequatchie lo
- Page 120 and 121:
108 Soil Survey Woodland Potential
- Page 122 and 123:
110 Soil Survey 12 to 40 inches—y
- Page 124 and 125:
112 Soil Survey Root zone: Shack—
- Page 126 and 127:
114 Soil Survey Substratum: 45 to 5
- Page 128 and 129:
116 Soil Survey Subsoil: 7 to 16 in
- Page 130 and 131:
118 Soil Survey Surface layer: 0 to
- Page 132 and 133:
120 Soil Survey Flooding: None Slop
- Page 134 and 135:
122 Soil Survey Land capability cla
- Page 136 and 137:
124 Soil Survey Urban development S
- Page 138 and 139:
126 Soil Survey Preferred trees to
- Page 140 and 141:
128 Soil Survey WaA—Wax fine sand
- Page 142 and 143:
130 Soil Survey Preferred trees to
- Page 144 and 145:
132 Soil Survey Woodland Potential
- Page 146 and 147:
134 Soil Survey Cropland, hayland,
- Page 148 and 149:
136 Soil Properties and Qualities D
- Page 150 and 151:
138 Soil Survey on the use and the
- Page 152 and 153:
140 Soil Survey are grouped accordi
- Page 154 and 155:
142 Soil Survey Virgin forest once
- Page 156 and 157:
144 Soil Survey In the tables descr
- Page 158 and 159:
146 Soil Survey observed in the soi
- Page 160 and 161:
148 Soil Survey Local roads and str
- Page 162 and 163:
150 Soil Survey The ratings are bas
- Page 165 and 166:
Soil Properties 153 Data relating t
- Page 167 and 168:
Murray and Whitfield Counties, Geor
- Page 169:
Murray and Whitfield Counties, Geor
- Page 172 and 173:
160 Soil Survey series. A pedon, a
- Page 174 and 175:
162 Soil Survey Parent material: Co
- Page 176 and 177:
164 Soil Survey pale brown (10YR 6/
- Page 178 and 179:
166 Soil Survey A or Ap horizon: Co
- Page 180 and 181:
168 Soil Survey Depth to seasonal h
- Page 182 and 183:
170 Soil Survey coarse irregular so
- Page 184 and 185:
172 Soil Survey BC horizon (where p
- Page 186 and 187:
174 Soil Survey Slope range: 0 to 5
- Page 188 and 189:
176 Soil Survey A or Ap horizon: Co
- Page 190 and 191:
178 Soil Survey Capshaw soils, whic
- Page 192 and 193:
180 Soil Survey medium, and few coa
- Page 194 and 195:
182 Soil Survey Depth to hard bedro
- Page 196 and 197:
184 Soil Survey Guthrie Series Majo
- Page 198 and 199:
186 Soil Survey Typical Pedon Hance
- Page 200 and 201:
188 Soil Survey Parent material: Lo
- Page 202 and 203:
190 Soil Survey roots and common co
- Page 204 and 205: 192 Soil Survey Slope range: 0 to 2
- Page 206 and 207: 194 Soil Survey R—39 inches; hard
- Page 208 and 209: 196 Soil Survey Depth class: Shallo
- Page 210 and 211: 198 Soil Survey Bt horizon: Color
- Page 212 and 213: 200 Soil Survey Panama Series Major
- Page 214 and 215: 202 Soil Survey topographic quadran
- Page 216 and 217: 204 Soil Survey medium subangular b
- Page 218 and 219: 206 Soil Survey E horizon (where pr
- Page 220 and 221: 208 Soil Survey Shelocta Series Maj
- Page 222 and 223: 210 Soil Survey fine, fine, medium,
- Page 224 and 225: 212 Soil Survey Geographically Asso
- Page 226 and 227: 214 Soil Survey A or Ap horizon: Co
- Page 228 and 229: 216 Soil Survey Typical Pedon Wax f
- Page 230 and 231: 218 Soil Survey Range in Characteri
- Page 233 and 234: Formation of the Soils This section
- Page 235 and 236: Murray and Whitfield Counties, Geor
- Page 237 and 238: References American Association of
- Page 239 and 240: Glossary 227 Many of the terms rela
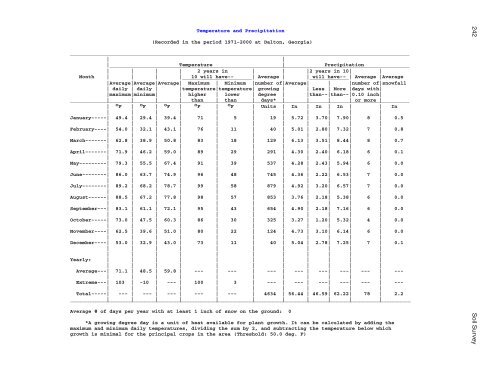
- Page 241 and 242: Murray and Whitfield Counties, Geor
- Page 243 and 244: Murray and Whitfield Counties, Geor
- Page 245 and 246: Murray and Whitfield Counties, Geor
- Page 247 and 248: Murray and Whitfield Counties, Geor
- Page 249 and 250: Murray and Whitfield Counties, Geor
- Page 251: Murray and Whitfield Counties, Geor
- Page 256 and 257: 244 Soil Survey Acreage and Proport
- Page 258 and 259: 246 Soil Survey Acreage and Proport
- Page 260 and 261: 248 Soil Survey Nonirrigated Yields
- Page 262 and 263: 250 Soil Survey Nonirrigated Yields
- Page 264 and 265: 252 Soil Survey Nonirrigated Yields
- Page 266 and 267: 254 Soil Survey Prime Farmland and
- Page 268 and 269: 256 Soil Survey Forestland Producti
- Page 270 and 271: 258 Soil Survey Forestland Producti
- Page 272 and 273: 260 Soil Survey Forestland Producti
- Page 274 and 275: 262 Soil Survey Forestland Producti
- Page 276 and 277: 264 Soil Survey Forestland Producti
- Page 278 and 279: 266 Soil Survey Forestland Producti
- Page 280 and 281: 268 Soil Survey Forestland Producti
- Page 282 and 283: 270 Soil Survey Log Landings, Hazar
- Page 284 and 285: 272 Soil Survey Log Landings, Hazar
- Page 286 and 287: 274 Soil Survey Log Landings, Hazar
- Page 288 and 289: 276 Soil Survey Log Landings, Hazar
- Page 290 and 291: 278 Soil Survey Log Landings, Hazar
- Page 292 and 293: 280 Soil Survey Log Landings, Hazar
- Page 294 and 295: 282 Soil Survey Forestland Planting
- Page 296 and 297: 284 Soil Survey Forestland Planting
- Page 298 and 299: 286 Soil Survey Forestland Planting
- Page 300 and 301: 288 Soil Survey Forestland Planting
- Page 302 and 303: 290 Soil Survey Forestland Planting
- Page 304 and 305:
292 Soil Survey Forestland Planting
- Page 306 and 307:
294 Soil Survey Forestland Planting
- Page 308 and 309:
296 Soil Survey Camp Areas and Picn
- Page 310 and 311:
298 Soil Survey Camp Areas and Picn
- Page 312 and 313:
300 Soil Survey Camp Areas and Picn
- Page 314 and 315:
302 Soil Survey Camp Areas and Picn
- Page 316 and 317:
304 Soil Survey Camp Areas and Picn
- Page 318 and 319:
306 Soil Survey Camp Areas and Picn
- Page 320 and 321:
308 Soil Survey Playgrounds and Pat
- Page 322 and 323:
310 Soil Survey Playgrounds and Pat
- Page 324 and 325:
312 Soil Survey Playgrounds and Pat
- Page 326 and 327:
314 Soil Survey Playgrounds and Pat
- Page 328 and 329:
316 Soil Survey Playgrounds and Pat
- Page 330 and 331:
318 Soil Survey Playgrounds and Pat
- Page 332 and 333:
320 Soil Survey Playgrounds and Pat
- Page 334 and 335:
322 Soil Survey Dwellings (The info
- Page 336 and 337:
324 Soil Survey Dwellings—Continu
- Page 338 and 339:
326 Soil Survey Dwellings—Continu
- Page 340 and 341:
328 Soil Survey Dwellings—Continu
- Page 342 and 343:
330 Soil Survey Dwellings—Continu
- Page 344 and 345:
332 Soil Survey Dwellings—Continu
- Page 346 and 347:
334 Soil Survey Dwellings—Continu
- Page 348 and 349:
336 Soil Survey Roads and Streets a
- Page 350 and 351:
338 Soil Survey Roads and Streets a
- Page 352 and 353:
340 Soil Survey Roads and Streets a
- Page 354 and 355:
342 Soil Survey Roads and Streets a
- Page 356 and 357:
344 Soil Survey Roads and Streets a
- Page 358 and 359:
346 Soil Survey Roads and Streets a
- Page 360 and 361:
348 Soil Survey Roads and Streets a
- Page 362 and 363:
350 Soil Survey Sewage Disposal (Th
- Page 364 and 365:
352 Soil Survey Sewage Disposal—C
- Page 366 and 367:
354 Soil Survey Sewage Disposal—C
- Page 368 and 369:
356 Soil Survey Sewage Disposal—C
- Page 370 and 371:
358 Soil Survey Sewage Disposal—C
- Page 372 and 373:
360 Soil Survey Sewage Disposal—C
- Page 374 and 375:
362 Soil Survey Sewage Disposal—C
- Page 376 and 377:
364 Soil Survey Sewage Disposal—C
- Page 378 and 379:
366 Soil Survey Sewage Disposal—C
- Page 380 and 381:
368 Soil Survey Source of Sand, Roa
- Page 382 and 383:
370 Soil Survey Source of Sand, Roa
- Page 384 and 385:
372 Soil Survey Source of Sand, Roa
- Page 386 and 387:
374 Soil Survey Source of Sand, Roa
- Page 388 and 389:
376 Soil Survey Source of Sand, Roa
- Page 390 and 391:
378 Soil Survey Source of Sand, Roa
- Page 392 and 393:
380 Soil Survey Source of Sand, Roa
- Page 394 and 395:
382 Soil Survey Source of Sand, Roa
- Page 396 and 397:
384 Soil Survey Ponds and Embankmen
- Page 398 and 399:
386 Soil Survey Ponds and Embankmen
- Page 400 and 401:
388 Soil Survey Ponds and Embankmen
- Page 402 and 403:
390 Soil Survey Ponds and Embankmen
- Page 404 and 405:
392 Soil Survey Ponds and Embankmen
- Page 406 and 407:
394 Soil Survey Ponds and Embankmen
- Page 408 and 409:
396 Soil Survey Ponds and Embankmen
- Page 410 and 411:
Engineering Properties—Continued
- Page 412 and 413:
Engineering Properties—Continued
- Page 414 and 415:
Engineering Properties—Continued
- Page 416 and 417:
Engineering Properties—Continued
- Page 418 and 419:
Engineering Properties—Continued
- Page 420 and 421:
Engineering Properties—Continued
- Page 422 and 423:
Engineering Properties—Continued
- Page 424 and 425:
Engineering Properties—Continued
- Page 426 and 427:
Engineering Properties—Continued
- Page 428 and 429:
Engineering Properties—Continued
- Page 430 and 431:
Engineering Properties—Continued
- Page 432 and 433:
Engineering Properties—Continued
- Page 434 and 435:
Engineering Properties—Continued
- Page 436 and 437:
Engineering Properties—Continued
- Page 438 and 439:
Engineering Properties—Continued
- Page 440 and 441:
428 Soil Survey Physical and Chemic
- Page 442 and 443:
430 Soil Survey Physical and Chemic
- Page 444 and 445:
432 Soil Survey Physical and Chemic
- Page 446 and 447:
434 Soil Survey Physical and Chemic
- Page 448 and 449:
436 Soil Survey Physical and Chemic
- Page 450 and 451:
438 Soil Survey Physical and Chemic
- Page 452 and 453:
440 Soil Survey Physical and Chemic
- Page 454 and 455:
442 Soil Survey Water Features (Dep
- Page 456 and 457:
444 Soil Survey Water Features—Co
- Page 458 and 459:
446 Soil Survey Water Features—Co
- Page 460 and 461:
448 Soil Survey Water Features—Co
- Page 462 and 463:
450 Soil Survey Soil Features (See
- Page 464 and 465:
452 Soil Survey Soil Features—Con
- Page 466 and 467:
454 Soil Survey Soil Features—Con
- Page 468 and 469:
456 Soil Survey Soil Features—Con
- Page 471:
NRCS Accessibility Statement The Na