- Page 1 and 2:
STOCHASTIC OPTIMIZATION MODELS IN F
- Page 4 and 5:
STOCHASTIC OPTIMIZATION MODELS IN F
- Page 6:
Dedicated to the memory of my fathe
- Page 9 and 10:
PART II. QUALITATIVE ECONOMIC RESUL
- Page 11 and 12:
2. Risk Aversion over Time Implies
- Page 14 and 15:
PREFACE AND BRIEF NOTES TO THE 2006
- Page 16 and 17:
and shows that current research in
- Page 18 and 19:
1990. This area presages the CVaR l
- Page 20 and 21:
transaction cost band. Most such mo
- Page 22 and 23:
through targets and are less sensit
- Page 24 and 25:
ing dates, the papers by Breiman, H
- Page 26 and 27:
Carino, D. and W.T. Ziemba (1998).
- Page 28 and 29:
Kallberg, J.G. and W.T. Ziemba (198
- Page 30 and 31:
Stone, D. and W.T. Ziemba (1993). L
- Page 32 and 33:
PREFACE IN 1975 EDITION There is no
- Page 34:
particular results are generally st
- Page 37:
Part I Mathematical Tools
- Page 40 and 41:
wealth, then his utility function m
- Page 42 and 43:
cases in Exercise CR-12. The relati
- Page 44 and 45:
However, some extensions to infinit
- Page 47 and 48:
1. EXPECTED UTILITY THEORY The Anna
- Page 49 and 50:
SUBJECTIVE PROBABILITIES ANT EXPECT
- Page 51 and 52:
SUBJECTIVE PROBABILITIES AND EXPECT
- Page 53 and 54:
SUBJECTIVE PROBABILITIES AND EXPECT
- Page 55 and 56:
SUBJECTIVE PROBABILITIES AND EXPECT
- Page 57:
SUBJECTIVE PROBABILITIES AND EXPECT
- Page 60 and 61:
282 O. L. MANGA3ARIAN" for every X
- Page 62 and 63:
284 O. L. MANGASARIAN We have from
- Page 64 and 65:
280 O. L. MANQASARIAN For the case
- Page 66 and 67:
288 O. L. MANGASAMAN Proof. Conside
- Page 68 and 69:
290 O. L. MANGASARIAN Second Berkel
- Page 70 and 71:
denotes the /w-dimensional vector o
- Page 72 and 73:
Proof (I) We shall prove this part
- Page 74 and 75:
(Ill) have not, to the author's kno
- Page 76 and 77:
for the case (3); and for the case
- Page 79 and 80:
3. DYNAMIC PROGRAMMING Introduction
- Page 81 and 82:
INTRODUCTION TO DYNAMIC PROGRAMMING
- Page 83 and 84:
INTRODUCTION TO DYNAMIC PROGRAMMING
- Page 85 and 86:
INTRODUCTION TO DYNAMIC PROGRAMMING
- Page 87 and 88:
INTRODUCTION TO DYNAMIC PROGRAMMING
- Page 89 and 90:
INTRODUCTION TO DYNAMIC PROGRAMMING
- Page 91 and 92:
INTRODUCTION TO DYNAMIC PROGRAMMING
- Page 93 and 94:
COMPUTATIONAL AND REVIEW EXERCISES
- Page 95 and 96:
(d) xxx2 on E+ 2 = {x\xt = 0, x2 S
- Page 97 and 98:
Show that the Kuhn-Tucker condition
- Page 99 and 100:
(a) Show that/, (b, c) = gt (Z>, c)
- Page 101:
(c) Show that the monotonicity assu
- Page 104 and 105:
An individual's preferences are sai
- Page 106 and 107:
12. (Hessians, bordered Hessians, c
- Page 108 and 109:
The problem in (b)-(c) hints that t
- Page 110 and 111:
(1) Suppose/is twice continuously d
- Page 112 and 113:
(f) Assume that R(i,a) g 0 and the
- Page 114 and 115:
(j) Show that an optimal policy Va
- Page 117 and 118:
INTRODUCTION In the second part of
- Page 119 and 120:
andom variables when the utility fu
- Page 121 and 122:
detailed analysis of the qualitativ
- Page 123 and 124:
separation in a local sense (for al
- Page 125 and 126:
1. STOCHASTIC DOMINANCE G. Hanoch a
- Page 127 and 128:
But now, EFFICIENCY ANALYSIS OF CHO
- Page 129 and 130:
EFFICIENCY ANALYSIS OF CHOICES INVO
- Page 131 and 132:
EFFICIENCY ANALYSIS OF CHOICES INVO
- Page 133 and 134:
EFFICIENCY ANALYSIS OF CHOICES INVO
- Page 135 and 136:
EFFICIENCY ANALYSIS OF CHOICES INVO
- Page 137 and 138:
A Unified Approach to Stochastic Do
- Page 139 and 140:
A UNIFIED APPROACH TO STOCHASTIC DO
- Page 141 and 142:
A UNIFIED APPROACH TO STOCHASTIC DO
- Page 143 and 144:
A UNIFIED APPROACH TO STOCHASTIC DO
- Page 145 and 146:
A UNIFIED APPROACH TO STOCHASTIC DO
- Page 147 and 148:
A UNIFIED APPROACH TO STOCHASTIC DO
- Page 149:
A UNIFIED APPROACH TO STOCHASTIC DO
- Page 152 and 153:
RISK AVERSION 123 a given risk the
- Page 154 and 155:
RISK AVERSION 125 If z is actuarial
- Page 156 and 157:
RISK AVERSION 127 4. CONCAVITY The
- Page 158 and 159:
To show that (a) implies (d), note
- Page 160 and 161:
RISK AVERSION 131 (b') The risk pre
- Page 162 and 163:
9.2. Example 2. If (30) u'(x)=(x°
- Page 164 and 165:
RISK AVERSION 135 12. INCREASING AN
- Page 166 and 167:
ADDENDUM In retrospect, 1 wish foot
- Page 168 and 169:
14 THE REVIEW OF ECONOMICS AND STAT
- Page 170 and 171:
16 THE REVIEW OF ECONOMICS AND STAT
- Page 172 and 173:
18 THE REVIEW OF ECONOMICS AND STAT
- Page 174 and 175:
20 THE REVIEW OF ECONOMICS AND STAT
- Page 176 and 177:
22 THE REVIEW OF ECONOMICS AND STAT
- Page 178 and 179:
24 THE REVIEW OF ECONOMICS AND STAT
- Page 180 and 181:
26 THE REVIEW OF ECONOMICS AND STAT
- Page 182 and 183:
28 THE REVIEW OF ECONOMICS AND STAT
- Page 184 and 185:
30 THE REVIEW OF ECONOMICS AND STAT
- Page 186 and 187:
32 THE REVIEW OF ECONOMICS AND STAT
- Page 188 and 189:
34 THE REVIEW OF ECONOMICS AND STAT
- Page 190 and 191:
36 THE REVIEW OF ECONOMICS AND STAT
- Page 193 and 194:
Separation in Portfolio Analysis R.
- Page 195 and 196:
SEPARATION IN PORTFOLIO ANALYSIS an
- Page 197 and 198:
SEPARATION IN PORTFOLIO ANALYSIS II
- Page 199 and 200:
SEPARATION IN PORTFOLIO ANALYSIS Th
- Page 201 and 202:
SEPARATION IN PORTFOLIO ANALYSIS Ca
- Page 203 and 204:
SEPARATION IN PORTFOLIO ANALYSIS It
- Page 205 and 206:
SEPARATION IN PORTFOLIO ANALYSIS th
- Page 207 and 208:
COMPUTATIONAL AND REVIEW EXERCISES
- Page 209 and 210:
7. Consider an investor having the
- Page 211 and 212:
Then eliminate p from (2) to obtain
- Page 213 and 214:
(a) Show that an indifference curve
- Page 215 and 216:
(d) Develop a similar result to (c)
- Page 217:
Exercise Source Notes Exercise 1 wa
- Page 220 and 221:
(f) Show that k > 0. [Note (Exercis
- Page 222 and 223:
(c) Interpret (b). (d) Illustrate s
- Page 224 and 225: 9. Let the partial relative risk-av
- Page 226 and 227: Condition (iv) is called the "no-ea
- Page 228 and 229: Then * ( 8xj \ V - s u = \-r-\ -ax,
- Page 230 and 231: exhibiting decreasing absolute and
- Page 232 and 233: (a) Determine necessary and suffici
- Page 234 and 235: Let the random variables Og^Sl and
- Page 237: Part III Static Portfolio Selection
- Page 240 and 241: given parameter. Exercise ME-30 dev
- Page 242 and 243: utility function. However, many con
- Page 244 and 245: the characteristic exponent is 2 (i
- Page 246 and 247: proportions to maximize expected ut
- Page 248 and 249: investment returns are always nonne
- Page 250 and 251: case to a case of one riskless and
- Page 252 and 253: 538 REVIEW OF ECONOMIC STUDIES Howe
- Page 254 and 255: 540 REVIEW OF ECONOMIC STUDIES wher
- Page 256 and 257: 542 REVIEW OF ECONOMIC STUDIES expa
- Page 258 and 259: JAMES A. OHLSON that quadratic util
- Page 260 and 261: JAMES A. OHLSON Assumptions A1-A3 a
- Page 262 and 263: JAMES A. OHLSON (i) snpl/ieSi\U (3)
- Page 264 and 265: JAMES A. OHLSON A number of interes
- Page 266 and 267: JAMES A. OHLSON for all y,teSx'3C{Q
- Page 268 and 269: Since Z"=o^( w »0 = 0 and/(«,«)
- Page 270 and 271: JAMES A. OHLSON analysis here is "o
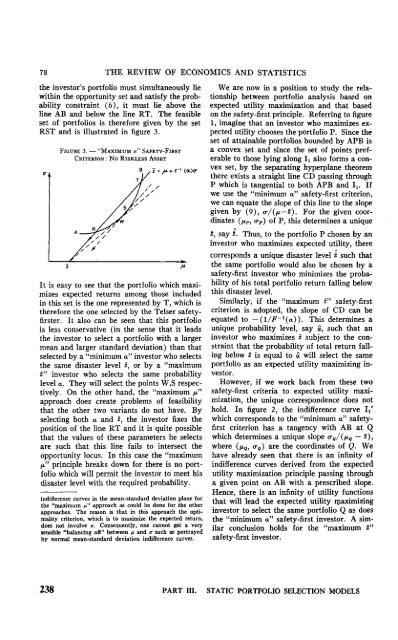
- Page 272 and 273: 76 THE REVIEW OF ECONOMICS AND STAT
- Page 276 and 277: 80 THE REVIEW OF ECONOMICS AND STAT
- Page 279 and 280: Choosing Investment Portfolios When
- Page 281 and 282: CHOOSING INVESTMENT PORTFOLIOS univ
- Page 283 and 284: CHOOSING INVESTMENT PORTFOLIOS The/
- Page 285 and 286: CHOOSING INVESTMENT PORTFOLIOS Tobi
- Page 287 and 288: CHOOSING INVESTMENT PORTFOLIOS a-di
- Page 289 and 290: CHOOSING INVESTMENT PORTFOLIOS Henc
- Page 291 and 292: CHOOSING INVESTMENT PORTFOLIOS Lemm
- Page 293 and 294: CHOOSING INVESTMENT PORTFOLIOS ID.
- Page 295 and 296: CHOOSING INVESTMENT PORTFOLIOS Proo
- Page 297 and 298: CHOOSING INVESTMENT PORTFOLIOS is c
- Page 299 and 300: CHOOSING INVESTMENT PORTFOLIOS Proo
- Page 301 and 302: CHOOSING INVESTMENT PORTFOLIOS 3. C
- Page 303 and 304: 2. EXISTENCE AND DIVERSIFICATION OF
- Page 305 and 306: ON THE EXISTENCE OF OPTIMAL POLICIE
- Page 307 and 308: ON THE EXISTENCE OF OPTIMAL POLICIE
- Page 309 and 310: ON THE EXISTENCE OF OPTIMAL POLICIE
- Page 311 and 312: ON THE EXISTENCE OF OPTIMAL POLICIE
- Page 313 and 314: Reprinted from Journal of Financial
- Page 315 and 316: Remarks: Differentiability assumpti
- Page 317 and 318: distributed from the rest. Then an
- Page 319 and 320: x * "22 "12 1 " (o22- a12) + (0n -
- Page 321 and 322: to decline — as if having more mo
- Page 323 and 324: solved for as a function 8.(y,0"),
- Page 325:
FOOTNOTES 1. H. Makower and J. Mars
- Page 328 and 329:
264 QUARTERLY JOURNAL OF ECONOMICS
- Page 330 and 331:
266 QUARTERLY JOURNAL OF ECONOMICS
- Page 332 and 333:
268 QUARTERLY JOURNAL OF ECONOMICS
- Page 334 and 335:
270 QUARTERLY JOURNAL OF ECONOMICS
- Page 336 and 337:
272 QUARTERLY JOURNAL OF ECONOMICS
- Page 338 and 339:
274 QUARTERLY JOURNAL OP ECONOMICS
- Page 340 and 341:
276 QUARTERLY JOURNAL OF ECONOMICS
- Page 342 and 343:
278 QUARTERLY JOURNAL OF ECONOMICS
- Page 344 and 345:
280 QVABTBRLY JOURNAL OF ECONOMICS
- Page 346 and 347:
282 QUARTERLY JOURNAL OF ECONOMICS
- Page 349 and 350:
Reprinted from THE REVIEW OF ECONOM
- Page 351 and 352:
(1.1) and (1.2) give SOME EFFECTS O
- Page 353 and 354:
SOME EFFECTS OF TAXES ON RISK-TAKIN
- Page 355 and 356:
SOME EFFECTS OF TAXES ON RISK-TAKIN
- Page 357 and 358:
SOME EFFECTS OF TAXES ON RISK-TAKIN
- Page 359 and 360:
SOME EFFECTS OF TAXES ON RISK-TAKIN
- Page 361 and 362:
SOME EFFECTS OF TAXES ON RISK-TAKIN
- Page 363 and 364:
SOME EFFECTS OF TAXES ON RISK-TAKIN
- Page 365 and 366:
REFERENCES SOME EFFECTS OF TAXES ON
- Page 367 and 368:
COMPUTATIONAL AND REVIEW EXERCISES
- Page 369 and 370:
and a gamble is offered that return
- Page 371 and 372:
among two risky assets and a riskle
- Page 373 and 374:
Consider problem (1) and suppose th
- Page 375 and 376:
21. Let pi,...,p„ be joint-normal
- Page 377:
Consider the following four utility
- Page 380 and 381:
4. In most stochastic optimizing mo
- Page 382 and 383:
(g) Discuss the use of semivariance
- Page 384 and 385:
(a) Suppose that the investor alloc
- Page 386 and 387:
The linear programming subproblems
- Page 388 and 389:
(f) Show that (j> is proportional t
- Page 390 and 391:
(e) Show that X has mean and varian
- Page 392 and 393:
(i) Show that for all Aru ...,km, t
- Page 394 and 395:
Some properties of the expected val
- Page 396 and 397:
(i) Suppose that V0 is positive def
- Page 398 and 399:
where V is the gradient operator an
- Page 400 and 401:
and where Z, Ylt...,Ym are independ
- Page 403 and 404:
INTRODUCTION This part of the book
- Page 405 and 406:
some qualitative characteristics of
- Page 407:
function of wealth. Hence the optim
- Page 410 and 411:
INVESTMENT ANALYSIS UNDER UNCERTAIN
- Page 412 and 413:
INVESTMENT ANALYSIS UNDER UNCERTAIN
- Page 414 and 415:
P if and only if INVESTMENT ANALYSI
- Page 416 and 417:
INVESTMENT ANALYSIS UNDEB UNCERTAIN
- Page 418 and 419:
INVESTMENT ANALYSIS UNDER UNCERTAIN
- Page 420 and 421:
INVESTMENT ANALYSIS UNDER UNCERTAIN
- Page 422 and 423:
INVESTMENT ANALYSIS UNDER UNCERTAIN
- Page 425 and 426:
2. RISK AVERSION OVER TIME IMPLIES
- Page 427 and 428:
ables at t, and the primed variable
- Page 429 and 430:
ehavior in choosing among timeless
- Page 431 and 432:
is to asume that the consumer behav
- Page 433 and 434:
The function t/,(C,_,, wt|a,, ft) i
- Page 435 and 436:
sumption, given state j3,+i at r+l,
- Page 437 and 438:
3. MYOPIC PORTFOLIO POLICIES Reprin
- Page 439 and 440:
326 THE JOURNAL OF BUSINESS this op
- Page 441 and 442:
328 THE JOURNAL OF BUSINESS with th
- Page 443 and 444:
330 THE JOURNAL OF BUSINESS In sum
- Page 445 and 446:
332 THE JOURNAL OF BUSINESS subject
- Page 447:
334 THE JOURNAL OF BUSINESS myopic
- Page 450 and 451:
where and k" 1 f (Mt-Ui) 2 4k {Oi 1
- Page 453 and 454:
MIND-EXPANDING EXERCISES 1. Conside
- Page 455 and 456:
(i.e., partial separability) and #,
- Page 457 and 458:
(c) Discuss the solution properties
- Page 459 and 460:
(d) By differentiating (cl) and (c2
- Page 461:
Let U be the utility function for t
- Page 465 and 466:
INTRODUCTION I. Two-Period Consumpt
- Page 467 and 468:
asked to develop explicit solutions
- Page 469 and 470:
that the property of nonincreasing
- Page 471 and 472:
The Hakansson paper studies a gener
- Page 473 and 474:
In the Samuelson-Hakansson additive
- Page 475 and 476:
techniques. The article by Breiman
- Page 477 and 478:
enously). These requirements are to
- Page 479 and 480:
in general, a monotonic function of
- Page 481 and 482:
ergodic theory, the book by Breiman
- Page 483 and 484:
or less than u; either do nothing o
- Page 485 and 486:
ME-24 the reader is invited to cons
- Page 487:
In discrete time, a nonnegative lin
- Page 490 and 491:
R. G. VICKSON This must not be inte
- Page 492 and 493:
This gives with R. G. VICKSON t(t)
- Page 495 and 496:
TWO-PERIOD CONSUMPTION MODELS AND P
- Page 497 and 498:
310 DRfeZE AND MODIGLIANI second or
- Page 499 and 500:
312 DREZE AND MODIGLIANI Had the sa
- Page 501 and 502:
314 DRfezE AND MODIGLIANI (— U^U^
- Page 503 and 504:
316 DREZE AND MODIGLIANI ure for te
- Page 505 and 506:
318 DREZE AND MODIGLIANI income sid
- Page 507 and 508:
320 DREZE AND MODIGLIANI (3.5) The
- Page 509 and 510:
322 DREZE AND MODIGLIANI Consumptio
- Page 511 and 512:
324 DREZE AND MODIGLIANI in (cj, c2
- Page 513 and 514:
326 DREZE AND MODIGLIANI Since d^Uj
- Page 515 and 516:
328 DREZE AND MODIGLIANI On the rig
- Page 517 and 518:
330 DRfeZE AND MODIGLIANI and its p
- Page 519 and 520:
332 DREZE AND M0DIGLIAN1 LEMMA C.2.
- Page 521 and 522:
334 DRfeZE AND MOD1GLIANI if the sm
- Page 523 and 524:
MANAGEMENT SCIENCE Vol. 19, No. 2,
- Page 525 and 526:
A DYNAMIC MODEL FOR BOND PORTFOLIO
- Page 527 and 528:
A DYNAMIC MODEL FOR BOND PORTFOLIO
- Page 529 and 530:
A DYNAMIC MODEL FOR BOND PORTFOLIO
- Page 531 and 532:
Maximize A DYNAMIC MODEL FOE BOND P
- Page 533 and 534:
A DYNAMIC MODEL FOR BOND PORTFOLIO
- Page 535:
A DYNAMIC MODEL FOR BOND PORTFOLIO
- Page 538 and 539:
MULTIPERIOD RISK PREFERENCE 41 mode
- Page 540 and 541:
MULTIPERIOD RISK PREFERENCE 43 The
- Page 542 and 543:
MULT1PERI0D RISK PREFERENCE between
- Page 544 and 545:
MULTIPERIOD RISK PREFERENCE 47 (ii)
- Page 546 and 547:
MULTIPERIOD RISK PREFERENCE 49 that
- Page 548 and 549:
or if s"(s' MULTIPERIOD RISK PREFER
- Page 550 and 551:
MULTIPERIOD RISK PREFERENCE 53 5. C
- Page 553 and 554:
Reprinted from The Review of Econom
- Page 555 and 556:
the risky asset, with 1 — w, goin
- Page 557 and 558:
w*t = glW,;Z,-1,...,Z0] = gT_i[W>]
- Page 559 and 560:
Since proof of the theorem is strai
- Page 561 and 562:
E C O N O M E T R I C A VOLUME 38 S
- Page 563 and 564:
OPTIMAL INVESTMENT 589 M: the numbe
- Page 565 and 566:
OPTIMAL INVESTMENT 591 For comparis
- Page 567 and 568:
(ii) in the case of Model III, 1 1
- Page 569 and 570:
Let Then OPTIMAL INVESTMENT 595 *.=
- Page 571 and 572:
where OPTIMAL INVESTMENT 597 (41) T
- Page 573 and 574:
where (54) T(x) = sup \ log c + log
- Page 575 and 576:
where b(v*) is the greatest lower b
- Page 577 and 578:
OPTIMAL INVESTMENT 603 noncapital i
- Page 579 and 580:
OPTIMAL INVESTMENT 605 Let us now t
- Page 581:
OPTIMAL INVESTMENT 607 REFERENCES [
- Page 584 and 585:
present value. Let ( be time, r the
- Page 586 and 587:
constant or decrease at a constant
- Page 588 and 589:
Denote the vector in the parenthese
- Page 590 and 591:
112 HOWARD M. TAYLOB easy to pictur
- Page 592 and 593:
114 HOWARD M. TAYLOR market and ign
- Page 594 and 595:
116 HOWARD M. TAYLOR the investor w
- Page 596 and 597:
118 HOWARD M. TAYLOR option which a
- Page 598 and 599:
120 HOWARD M. TAYLOR 3. BR.VDA, J.
- Page 600 and 601:
172 BASIL A. KALYMON more general p
- Page 602 and 603:
174 BASIL A. KALYMON The three case
- Page 604 and 605:
176 BASIL A. KALYMON an additional
- Page 606 and 607:
178 BASIL A. KALYMON (24) d\ = r -
- Page 608 and 609:
180 BASIL A. KALYMON The above resu
- Page 610 and 611:
182 BASIL A. KALYMON PROOF. First w
- Page 613 and 614:
MANAGEMENT SCIENCE Vol. 17, No. 7,
- Page 615 and 616:
M1NIMAX POLICIES FOB SELLING AN ASS
- Page 617 and 618:
MINIMAX POLICIES FOB SELLING AN ASS
- Page 619 and 620:
MINIMAX POLICIES FOR SELLING AN ASS
- Page 621 and 622:
MINIMAX POLICIES FOR SELLING AN ASS
- Page 623 and 624:
MINIMAX POLICIES TOR SELLING AN ASS
- Page 625 and 626:
MINIMAX POLICIES FOB SELLING AN ASS
- Page 627:
MINIMAX POLICIES FOR SELLING AN ASS
- Page 630 and 631:
648 L. BREIMAN We have discussed th
- Page 632 and 633:
650 L. BREIMAN Hence, it is suffici
- Page 634 and 635:
(a.s.) on the set lim XN < oo > u <
- Page 636 and 637:
EDWARD O. THORP method to this arti
- Page 638 and 639:
EDWARD O. THORP drastic simplificat
- Page 640 and 641:
EDWARD O. THORP us is that the prop
- Page 642 and 643:
EDWARD O. THORP Let the range of Rj
- Page 644 and 645:
EDWARD O. THORP is approximately on
- Page 646 and 647:
EDWARD O. THORP choosing P in repea
- Page 648 and 649:
EDWARD O. THORP return from the hed
- Page 650 and 651:
EDWARD O. THORP it is plausible to
- Page 652 and 653:
EDWARD O. THORP is maximization of
- Page 654 and 655:
EDWARD O. THORP 6. BREIMAN, L., "Op
- Page 657 and 658:
Reprinted from JOURNAL OF ECONOMIC
- Page 659 and 660:
CONSUMPTION AND PORTFOLIO RULES 375
- Page 661 and 662:
CONSUMPTION AND PORTFOLIO RULES 377
- Page 663 and 664:
and CONSUMPTION AND PORTFOLIO RULES
- Page 665 and 666:
CONSUMPTION AND PORTFOLIO RULES giv
- Page 667 and 668:
CONSUMPTION AND PORTFOLIO RULES 383
- Page 669 and 670:
and CONSUMPTION AND PORTFOLIO RULES
- Page 671 and 672:
and CONSUMPTION AND PORTFOLIO RULES
- Page 673 and 674:
CONSUMPTION AND PORTFOLIO RULES 389
- Page 675 and 676:
CONSUMPTION AND PORTFOLIO RULES 391
- Page 677 and 678:
CONSUMPTION AND PORTFOLIO RULES 393
- Page 679 and 680:
CONSUMPTION AND PORTFOLIO RULES 395
- Page 681 and 682:
CONSUMPTION AND PORTFOLIO RULES 397
- Page 683 and 684:
CONSUMPTION AND PORTFOLIO RULES 399
- Page 685 and 686:
CONSUMPTION AND PORTFOLIO RULES 401
- Page 687 and 688:
CONSUMPTION AND PORTFOLIO RULES 403
- Page 689 and 690:
Yin CONSUMPTION AND PORTFOLIO RULES
- Page 691 and 692:
CONSUMPTION AND PORTFOLIO RULES 407
- Page 693 and 694:
Y(t) Y CONSUMPTION AND PORTFOLIO RU
- Page 695 and 696:
CONSUMPTION AND PORTFOLIO RULES 411
- Page 697:
CONSUMPTION AND PORTFOLIO RULES 413
- Page 700 and 701:
(d) Suppose n > r2. Formulate the o
- Page 702 and 703:
(j) Show that the absolute risk-ave
- Page 704 and 705:
The optimal first-period decision a
- Page 706 and 707:
(b) Show that the optimal policy in
- Page 708 and 709:
the game is stationary and favorabl
- Page 710 and 711:
(v) UHEV-E^CV-Af- 1 )^ w, V&0, w>0,
- Page 713 and 714:
MIND-EXPANDING EXERCISES 1. Conside
- Page 715 and 716:
Note the following distinction betw
- Page 717 and 718:
(e) Discuss the computational aspec
- Page 719 and 720:
(a) Show that U obeys the functiona
- Page 721 and 722:
(g) If ;ij(0) > 0 (1 g; g N), show
- Page 723 and 724:
Note that problem P2 has 3(N- 1)+1
- Page 725 and 726:
Note that (f) and (g) imply the exi
- Page 727 and 728:
P = (Pu), where pu = P[X„+l =j\ X
- Page 729 and 730:
(a) Show that {X„} is a stationar
- Page 731 and 732:
(b) Show that T T u = a + b Y[ c\'
- Page 733 and 734:
(b) Interpret this assumption. Is i
- Page 735 and 736:
(d) Show that (c) may be written as
- Page 737 and 738:
Bibliography Journal Abbreviations
- Page 739 and 740:
BHARUCHA-REID, A. T. (1960). Elemen
- Page 741 and 742:
FIACCO, A. V., and MCCORMICK, G. P.
- Page 743 and 744:
IGLEHART, D. (1965). "Capital accum
- Page 745 and 746:
MANGASARIAN, O. L. (1966). "Suffici
- Page 747 and 748:
PORTEUS, E. L. (1972). "Equivalent
- Page 749 and 750:
THOMASION, A. J. (1969). The Struct
- Page 751 and 752:
A Absolute risk aversion, 84, 85, 9
- Page 753 and 754:
Logarithmic utility functions, see
- Page 755 and 756:
V Value of information, 462-467, 68